Download

1 / 23
230 likes | 554 Views
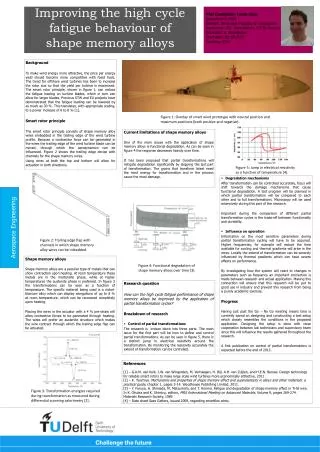
HIGH CYCLE FATIGUE DELAMINATION MEASUREMENT AND GROWTH PREDICTION. Adam Pickard and Stephen Hallett. www.bris.ac.uk/composites. Overview. Objective: Investigation of high cycle fatigue damage through vibration excitation at large amplitudes.

E N D
HIGH CYCLE FATIGUE DELAMINATION MEASUREMENT AND GROWTH PREDICTION Adam Pickard and Stephen Hallett www.bris.ac.uk/composites
Overview • Objective: Investigation of high cycle fatigue damage through vibration excitation at large amplitudes. • Sample design and artificial delamination production. • Experimental testing method and results. • Delamination growth prediction through FEM.
Sample Design 60mm • Small rectangular samples (300mm x 60mm). • Simple symmetric cross-ply lay-up = [(0/90)30s]. • IM7/8552 material. • Full width artificial delamination. 150mm 300mm
FEM Predicted behaviour • Modelled in MSC Nastran with shell elements, delamination used double layer of shells with offsets • Well separated modes, little incidence of harmonics mixing. • Frequency drop with damage indicates odd bending modes are most sensitive. • 2nd mode for driving damage, 3rd mode for damage detection.
Delamination Production • Delamination in initial samples produced with two layers of 15μm thick ETFE release film. • Great difficulty with propagating delamination – Not true delamination? • Force open delamination with feeler gauge – ruffle release film. • Attempted to use Steel Shim, 25μm thick, in place of release film. • Shim debonded easily but was not removable. • Improved initial condition allowed reproducible delamination behaviour and easier propagation.
Delamination Comparison • Both specimens produce good quality interface. • Using more shim metal to separate the shim insert produced an expanded delamination region. • Definite separation, although size of delaminated region is near 2/3 of a ply. • No evidence of fibre nesting with release film inserts. Shim ETFE
Set-up • The sample is clamped at the base and attached directly to the shaker armature. • A Polytech Scanning Laser Doppler Vibrometer (SLDV) measures the specimens velocity. • In house developed control system identifies and tracks the resonant frequency. • Automated periodic capture of frequency response and thermal imagery. CFRP Specimen E.M. Shaker Clamp
Vibration Characteristics • Initial vibration characteristics were investigated and showed a softening effect with increasing amplitude at the 2nd bending mode. • Conversely, a stiffening effect was observed at the 3rd bending mode. • ETFE insert samples were fatigued for 34 x 106 cycles with only 3 measurement occurences. • Shim insert samples were fatigued for 40 x 106 cycles with measurements every 5 x 10⁵ cycles.
Vibration Characteristics ETFE Insert MODE 2 Shim Insert
Vibration Characteristics ETFE Insert MODE 3 Shim Insert
Endurance Measurements - ETFE • Little variation was observed in the damping factor as the delamination grew. • Frequency drops indicate material softening. • Amplitude drops indicate material hardening. • Issue with nodal position?
Endurance Measurements - Shim • Different variations observed at each mode. • Mode 2 demonstrated clear increases in the amplitude of response at each voltage. • Mode 3 showed clear and consistent drops in frequency although small.
Endurance Measurements - ETFE • C-scan clearly shows delamination growth. • Thermal measurements potentially highlight delaminated region. • Damage shown here was after 34x106cycles.
Endurance Measurements - Shim • C-scan suggests separation and minimal growth. • Thermal measurements again highlight delaminated region. Before After
Endurance Measurements • A line scan for sample displacement was measured to identify possible movement of the vibration nodal position. • Shift of the node could cause erroneous displacement measurements. • Curvatures will be calculated to potentially identify damaged region.
Virtual Crack Closure Technique (VCCT) VCCT is commonly used to predict the growth of damage in composite samples. Sample is constructed with 2 surfaces of shell elements, nodes are connected with stiff springs. Springs constants are calculated from resin properties. The Strain Energy Release Rate can be calculated using the forces in the springs and the nodal displacements. Uz2 Fz Uz1 Measure displacement between nodes Measure force between nodes at delamination front.
Virtual Crack Closure Technique (VCCT) The calculated SERR can be used along with a Fatigue Delamination Growth Law. This allows the calculation of the number of cycles to failure. Mode ratio is predominantly mode II (95% top edge, 90% bottom edge). No R=-1 data for IM7/8552. Initial analyses used GIImax (R=0.1) = GIImax (R=-1). Tanaka and Tanaka* found a 3 order of magnitude difference between R=-1 and R=0.1 for Toray T800H/#3631 material. * Tanaka, K. and Tanaka, H., "Stress-Ratio Effect on Mode II Propagation of Interlaminar Fatigue Cracks in Graphite/Epoxy Composites," ASTM STP 1285, 1997, pp. 126-142.
VCCT Matlab Code Allows user to build model with delaminated region. Creates Nastran input files and interprets results files. Calculates SERR and determines which node reaches life limit first. This node is released whilst other nodes store percentage of life reached. Program iterates to identify next nodes to release. Hence, the code predicts delamination growth.
VCCT Converge on frequency value Run Modal Analysis Run Frequency Analysis Build Model Identify spring Forces and nodal Displacements Calculate Gmax Calculate da/dN and thus dN Calculate proportion of life reached at every node Release critical node/nodes Re-run from Modal Analysis
Comparison The values were predicted with R=0.1 data. Using the 3 orders of magnitude variation, these values predict a detectable delamination growth of 3mm within 10 x 106 cycles. From experimental results, damage has become detectable after 25 x 106 cycles. Delamination growth pattern appears accurate. Issues remain with true delamination condition. R=-1 data required to improve routine accuracy.
Conclusions Excitation to high amplitudes extremely difficult. Response is non-linear with high amplitudes and varies with excitation mode. Artificial delamination production technique influences results. Delamination growth only plausible for experimentation time at high amplitude with high cycles. VCCT can be used to predict delamination growth in dynamic testing. IM7/8552 data for R=-1 required to validate method. Further testing required to gather more data.
Acknowledgement This work has been supported by Rolls-Royce plc.