Download
1 / 3
30 likes | 223 Views
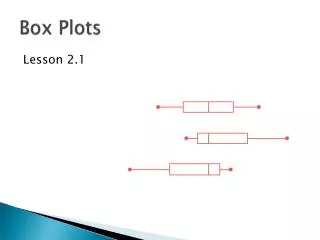
Box Plots Calculator Commands. 12/1/10. Locating the 5-Number Summary on TI83/84. A box plot is a graph of the 5-# Summary for a set of data. You can find the 5-Number Summary on your TI83/84: Enter your data in L1 Quit from the screen using 2 nd Mode Go to STAT: CALC

E N D
Box Plots Calculator Commands 12/1/10
Locating the 5-Number Summary on TI83/84 A box plot is a graph of the 5-# Summary for a set of data. You can find the 5-Number Summary on your TI83/84: • Enter your data in L1 • Quit from the screen using 2nd Mode • Go to STAT: CALC • Highlight 1: 1-Var Stats • Hit ENTER. The words 1-Var Stats appear on your home screen • Type L1; Hit ENTER • At the bottom of your screen you should see n = ___. Scroll down with the down arrow key: MinX; Q1;Med; Q3;MaxX should appear. These are the 5-# Summary • Use them to construct your box plot CA Stats Standard 3.0
Drawing Modified Box Plot on TI83/84 Your calculator will draw the box plot for you: • Enter your data in L1 • Quit from the screen using 2ndMode (home screen) • Go to 2nd: Y= (at the top of your keyboard, left side) • Highlight 1: Plot one. Hit ENTER • Turn Plot ON with ENTER key. Arrow down to next row. • Select 4th choice (use arrow right key) Modified Box Plot. Hit ENTER. • Arrow down to Xlist should say L1 or type it. FREQ = 1 • Zoom key (top row in middle). Go to 9: ZoomStat to make the box fit the screen. Hit ENTER. Box plot appears. • Use TRACE key (top row 2nd from right) & right arrow to read the values from the box plot. 5-# Summary appears at the bottom of your screen. CA Stats Standard 3.0