Download
1 / 17
170 likes | 318 Views
Wealth and Poverty. Corporate Welfare. Estimates range from $93 to 175 billion a year goes to corporate welfare. 2. Tax breaks No sales tax on construction costs Limitations on various taxes, such as property or utility taxes, to lure companies to a town. 3. Subsidies

E N D
Corporate Welfare • Estimates range from $93 to 175 billion a year goes to corporate welfare. 2. Tax breaks • No sales tax on construction costs • Limitations on various taxes, such as property or utility taxes, to lure companies to a town. 3. Subsidies • Public funds to build roads and other infrastructure. • Public funds contributed to build facilities.
Key questions • Does the investment of public funds benefit the community? • How does it benefit? • Increased jobs • Increased tax revenues • A needed service that is otherwise unavailable • Community-building • Would the business set up shop without the assistance? • Does the company have to show its effectiveness over time?
Examples of Corp. WelfareGood Jobs First, 2001 • At least 44 of 60 (73%) private prisons had received a development subsidy from local, state and/or federal government sources. • 83 of 92 sports’ stadiums were built with subsidies; 32 were paid for entirely with public funds. • Walmart has received billions in the form of infrastructure subsidies, reduced land prices, etc. 1 million in Grandview, WA to build infrastructure.
Boeing • 2001, moved headquarters to Chicago. • In 2003, a 3.2 billion dollar subsidy package. • 2009, decided to build a plant in South Carolina. • 4% vs. 10.5% property tax for 30 years. • Tax credits for site improvements for 15 years. • 170 million in low interest loans • Commited to 3800 new jobs.
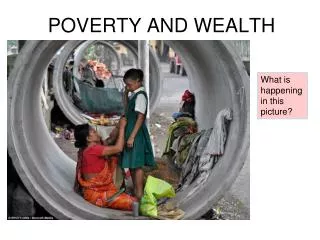
Definitions of poverty • Household income is inadequate to meet needs of family. • Relative poverty: break up the income range into percentiles and define a percentile as the poverty line. • Absolute poverty involves identifying a poverty line; anyone with income below the line is in poverty. We have the federal poverty guideline which is used to define eligibility criteria for many human services: http://aspe.hhs.gov/POVERTY/08poverty.shtml • 2000 census measured a rate of 11.3%; 12.5 in 2007. • In WA, 2001 rate was 9.9%; in 2007, 12.6%. • 20% live below 200% of the FPL. (SPAN)
Why are people poor?- Think Pair Share
Conceptualizations of Poverty • Poverty as deprivation • Poverty as inequality in distribution of income. • During the 1990s, the bottom 20% of earners saw a 4% increase in income; the top 20% saw a 27% increase. • Poverty as culture • Poverty as exploitation • Poverty as structure
Economic conditionsEconomic Opportunity Institute, The State of Working Washington, 2007 • Unemployment rate • Unemployment in WA has increased from 5% in 11/07 to 9% now. • Wage and Work Patterns • Middle and high earners’ wages increased faster than inflation in recent years. • Low wage earners’ wages have stayed the same or fallen. • The typical couple with kids worked 12.6% more hours in 2004 than in 1979 (U.S.) • Type of employment, e.g. • decline in high paid manufacturing jobs, from 26% in 1950 to 16% in 1990 to 10% in 2005 (state). • Increase of 22,000 manufacturing jobs between 2004 & 2006 (state). • Increase in service and retail jobs (state) • Increase in information technology jobs, down 5000 from 2001-2003, then up by 9800 by 2007 (King County).
Programs to address poverty • Residual programs-TANF, Food Assistance-http://www.cbpp.org/foodstamp-video.htm • Institutional programs-Social Security • Asset-building programs- • Individual Development Accounts-http://www.cbsnews.com/video/watch/?id=4597355n • Microlending • Children’s Saving Accounts • Connected by 25-Financial education and matching funds former foster youth
Temporary Assistance to Needy Families-a product of PRWORA* • Rough cost: 21.7 billion/year (includes cash grant, childcare funds, social services) • Goals of the program include: • Reduce the amount of money spent and number of families receiving benefits • Increase ability of families to be self-sufficient • To improve quality of life: A job, a better job, a better life *Personal responsibility and work opportunity reconciliation act **1996-direct cash grants=63% 2006-direct cash grants=41% 68% drop in case load between 1996 and 2007; 46% in WA
WorkFirst: WA’s TANF Program • Recipients will participate in Workfirst, a program designed to facilitate employment. • Recipients can receive benefits for a maximum of 5 years. • Exceptions exist which allow recipients to delay workfirst activities and receive benefits beyond the five year limit. • Parents of infants up to 1 year can postpone participation in workfirst. • A variety of services are offered to support recipients.
Services offered • Evaluation to determine what is needed to achieve self-sufficiency • Job skills assessment, basic education needs, job training, job search assistance • Mental health, chemical dependency, child with disability, etc. are examples of when a client might receive other services prior to seeking work • Childcare (Working Connections Childcare), transportation, work clothing, vehicle repair, tools, etc. • http://www.workfirst.wa.gov/about/StudyIndex2.htm
Outcomes of TANF and Workfirsthttp://www.workfirst.wa.gov/about/StudyIndex2.htm • Participants were 11% more likely to be employed after 30 hour job search workshop and they earned $114 more/month than nonparticipants • With short term job training, earnings were $209 more/month • The average wage of people leaving TANF was $8.88/hr. 68% who go to work, work full time. • Median wage was $9.46; with 1 year voc. Ed. $11.02
Reports of recipients-2001? • Quality of life is- • much better: 34% • somewhat better: 29% • the same: 24% • somewhat worse: 8% • Much worse: 6%
In computer lab… • You will be assigned a service to investigate. • Follow directions to the state website. • Investigate the service. • Identify • Who is eligible? • What is provided? • Other interesting info • Clearly list key points on newsprint.
Other indicators of success? What do you think indicates success? • Percent of Workfirst participants and completers living above the poverty line • Benefits associated with jobs • Emotional well-being of families • School success of kids in TANF families