Download
1 / 1

E N D
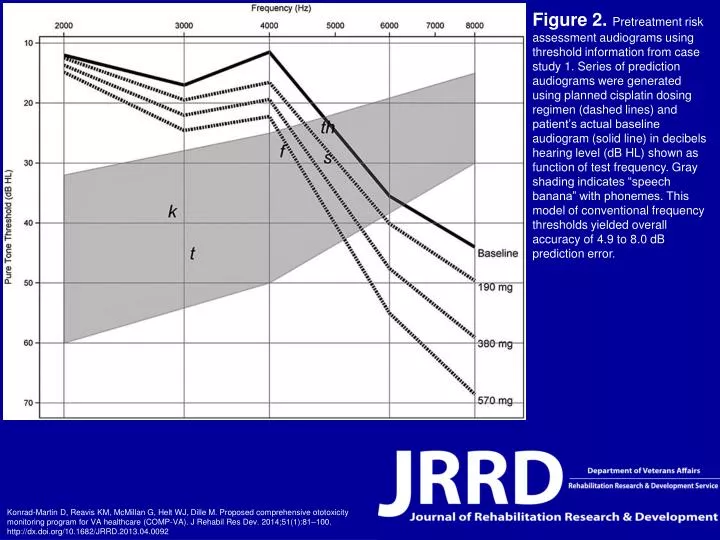
Figure 2. Pretreatment risk assessment audiograms using threshold information from case study 1. Series of prediction audiograms were generated using planned cisplatin dosing regimen (dashed lines) and patient’s actual baseline audiogram (solid line) in decibels hearing level (dB HL) shown as function of test frequency. Gray shading indicates “speech banana” with phonemes. This model of conventional frequency thresholds yielded overall accuracy of 4.9 to 8.0 dB prediction error. Konrad-Martin D, Reavis KM, McMillan G, Helt WJ, Dille M. Proposed comprehensive ototoxicity monitoring program for VA healthcare (COMP-VA). J Rehabil Res Dev. 2014;51(1):81–100. http://dx.doi.org/10.1682/JRRD.2013.04.0092
