Download
1 / 1
10 likes | 89 Views
Glyma11g19840. Glyma12g08650. Glyma12g30260. Combined. a. b. a. a. a. b. a. a. b. a. a. a. RPKM - LL. a. ab. b. a. a. b. a. b. a. a. a. b. RPKM - EL. *. *. Ln(EL/LL). *. *. *. D4. D4. D4. D4. D3. D3. D3. D3. T2. T2. T2. T2.

E N D
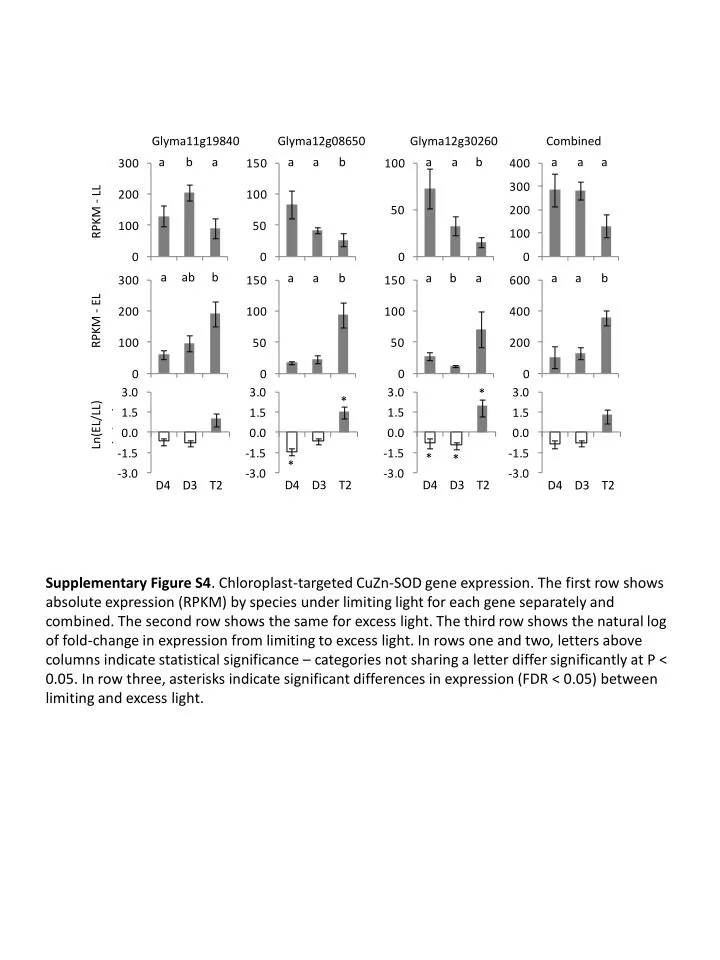
Glyma11g19840 Glyma12g08650 Glyma12g30260 Combined a b a a a b a a b a a a RPKM - LL a ab b a a b a b a a a b RPKM - EL * * Ln(EL/LL) * * * D4 D4 D4 D4 D3 D3 D3 D3 T2 T2 T2 T2 Supplementary Figure S4. Chloroplast-targeted CuZn-SOD gene expression. The first row shows absolute expression (RPKM) by species under limiting light for each gene separately and combined. The second row shows the same for excess light. The third row shows the natural log of fold-change in expression from limiting to excess light. In rows one and two, letters above columns indicate statistical significance – categories not sharing a letter differ significantly at P < 0.05. In row three, asterisks indicate significant differences in expression (FDR < 0.05) between limiting and excess light.
