Download
1 / 21
210 likes | 513 Views
Psychology Power Point Notes. PSY 101 Mr. Fetzner. 1.3 Statistical Reasoning Appendix A (pages 605+). Worth Publishers. NLshop / Fotolia.com. Table of Contents. Statistics Descriptive Statistics Inferential Statistics. 4 5 17. true. Descriptive statistics are ways of describing data.

E N D
Psychology Power Point Notes PSY 101 Mr. Fetzner 1.3 Statistical ReasoningAppendix A (pages 605+) Worth Publishers
NLshop/ Fotolia.com Table of Contents Statistics Descriptive Statistics Inferential Statistics 4 5 17
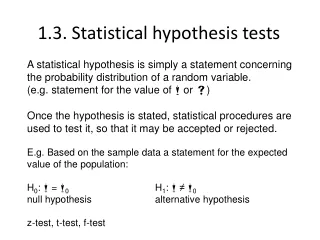
true Descriptive statistics are ways of describing data. true Two variables are negatively correlated if they change in opposite directions. false The median is the most frequently occurring score in a distribution. false The third variable problem is that all scientific studies must involve at least three variables. true Testing positive for measles when you don’t actually have measles is an example of a Type I error. Fact or Falsehood?
Statistics • A branch of mathematics used by researchers to organize, summarize, and interpret data • We use statistics both to describe data and as a basis for inferring information from data. • Statistics are often presented in a graphic or visual form. Keeweeboy/Dreamstime.com
Descriptive Statistics • Mathematical methods used to organize and summarize, or describe data Tetera images/Alamy • Q: How many hours do you exercise each week?
Descriptive Statistics • Q: How many hours do you exercise each week? • Frequency Distribution • A summary of how often various scores occur in a sample of scores. Score values are arranged in order of magnitude, and the number of occurrences is recorded. • A frequency polygon is a graphic representation of frequency distribution using points connected by straight lines. It is also known as a line graph. • A histogram is a graphic representation of frequency distribution using vertical bars. It is also known as a bar chart. • The simplest representation of a frequency distribution is a table
Descriptive Statistics • Frequency polygons quickly show if the shape of a distribution is skewed, or asymmetrical. In a skewed distribution, more scores occur on one side of the distribution than the other. • This polygon shows a • negative skew: more scores are at the higher end of the scale. • This polygon shows a • positive skew: more scores are at the lower end of the scale.
Descriptive Statistics • Measure of Central Tendency • A single number that presents information about the “center” of a frequency distribution. Cut and Deal/ Punchstock • Useful for putting information about a distribution into a more compact form, summarizing the distribution with a single score that is typical in some way
Descriptive Statistics: Measure of Central Tendency • Q: How many hours do you exercise each week? • 20 people respond: 0, 0, 0, 0, 0, 0, 1, 1, 1, 2, 2, 2, 2, 2, 2, 2, 3, 3, 3, 4 (hours) Mode—The most frequently occurring score in the distribution. • mode = 2 0, 0, 0, 0, 0, 0, 1, 1, 1, 2, 2, 2, 2, 2, 2, 2, 3, 3, 3, 4 Median—The score that divides a frequency distribution exactly in half. The same number of scores fall above and below the median. 0, 0, 0, 0, 0, 0, 1, 1, 1, 2, 2, 2, 2, 2, 2, 2, 3, 3, 3, 4 • median = 2 Mean—The sum of a set of scores in a distribution divided by the number of scores. The mean is also known as the average. • mean = 1.5 0, 0, 0, 0, 0, 0, 1, 1, 1, 2, 2, 2, 2, 2, 2, 2, 3, 3, 3, 4 (hours) 20 respondents
Descriptive Statistics:Measure of Central Tendency • Analyze Carefully! • Note how describing the mean, median, and mode in isolation in the distribution below can lead to misleading conclusions!
Descriptive StatisticsMeasure of Variability • Range – the highest score in the distribution minus the lowest score, a simple measure of variability. • Standard Deviation – the square root of the sum of the squared deviations from the mean divided by the number of scores in the distribution. The larger the standard deviation, the more spread out are the scores in a distribution.
Descriptive Statistics • Variability • Information about the spread of the scores in a distribution • These distributions have the same mean but different variability—the scores are spread out differently.
Descriptive Statistics:Measuring Variability – The Normal Curve • A theoretical distribution that is symmetrical with the mean, median, and mode all falling at the exact middle of the distribution • Sometimes called a “bell curve” or a standard normal curve/distribution
Descriptive StatisticsCorrelation: The Relationship Between Two Variables • Negative Correlation: • Two variables change systematically in the opposite directions, one increasing as the other decreases. • Positive Correlation: • Two variables change systematically in the same direction, either increasing or decreasing together. • Correlation directions are often shown in scatter plot diagrams such as this. • A scatter plot with points that seem to fall randomly indicates no correlation between the variables.
Descriptive Statistics • The Correlation Coefficient • The statistical measure of the relationship between two variables. The coefficient ranges from +1.00 to -1.00. • A -1.00 correlation, or a perfect negative correlation, would indicate that the frequency of the meditation routine was always accompanied by less smoking, and vice versa. • A +1.00 correlation, or a perfect positive correlation, would indicate that frequent yoga sessions were always accompanied by high levels of energy, and vice versa.
Correlation does not equal causation! Descriptive StatisticsCorrelation and Causality Q: What third variable might cause both aggression and the watching of violent programs? Q: Watching violent television programs is positively correlated with aggression in children. Does this mean that watching these programs causes aggression? • There are three possibilities: • Watching violent programs causes aggression. • Aggressive behavior causes children to watch violent programs. • A third variable causes both! • This is known as the third-variable problem.
Inferential Statistics • Mathematical methods used to draw conclusions about a population based on a sample of data • In psychology, inferential statistics are used to determine the likelihood of a study’s outcome being due to chance or to real differences. Reflexstock/Panthermedia Basic/GernotKrautberger
Inferential Statistics • The ability to make inferential statistics and the scope of the inferences depend on the population(acomplete set of something: people, nonhuman animals, objects, events) and sample(a subset of the population) of the subject under study. • The students in your class form the population of students studying psychology in this class, but they only form a sample of all the students at your institution. • All the doctors in the United States form the population of the doctors in the United States, but they only form a sample of the doctors in the world. • Information about a sample can be used to make inferences about the population. Photo credits, left to right: Corbis; Jupiterimages/Comstock Images /Alamy; Ocean/Corbis. Globe background under doctor photo is Stockbyte
Inferential Statistics Inferential Errors The data from a lie detector test indicate that a suspect is lying when he is actually telling the truth. • Type I error: Erroneously concluding that study results are significant • Type II error: Failing to find a significant effect that does, in fact, exist The data from a lie detector test indicate that a suspect is telling the truth when he is actually lying.
Inferential Statistics • How to Avoid Inferential Errors Generalizing from Samples • Representative samples are better than biased samples. • Less-variable observations are more reliable than those that are more variable. • More cases are better than fewer. • Look for statistical significance. The difference between observations is probably not due to chance variation between the samples. Stockbyte
Inferential Statistics • How to Avoid Inferential Errors Paying Attention to Methodology • In cross-sectional studies, different groups are studied at the same time. • In longitudinal studies, the same group is studied over time. • Cross-sectional studies show the effects of time and environment on many different individuals. • Longitudinal studies show these effects on the same people. Stockbyte