Download
1 / 1
10 likes | 39 Views
Axis Direct presents daily derivatives report presenting recommendations based on technical analysis. For trading in derivatives visit https://simplehai.axisdirect.in/offerings/products/derivatives<br>https://simplehai.axisdirect.in/share-stock-prices/nse/CEAT-Ltd-104<br>https://simplehai.axisdirect.in/share-stock-prices/nse/Jet-Airways-(India)-Ltd-5586<br><br>

E N D
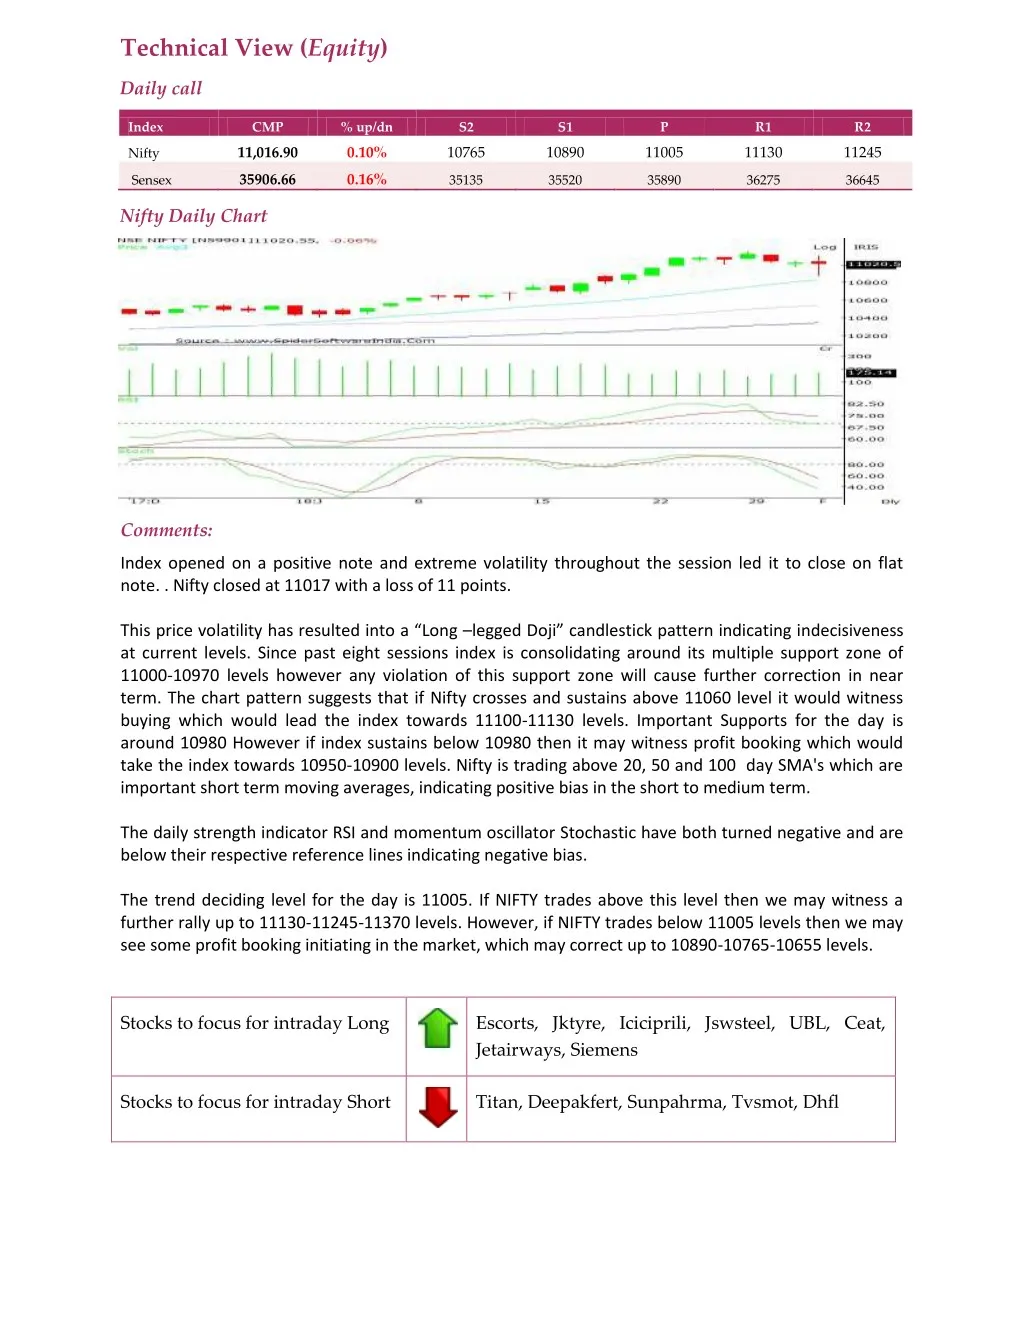
Technical View (Equity) Daily call Index CMP % up/dn S2 S1 P R1 R2 11,016.90 0.10% 10765 10890 11005 11130 11245 Nifty 35906.66 0.16% Sensex 35135 35520 35890 36275 36645 Nifty Daily Chart Comments: Index opened on a positive note and extreme volatility throughout the session led it to close on flat note. . Nifty closed at 11017 with a loss of 11 points. This price volatility has resulted into a “Long –legged Doji” candlestick pattern indicating indecisiveness at current levels. Since past eight sessions index is consolidating around its multiple support zone of 11000-10970 levels however any violation of this support zone will cause further correction in near term. The chart pattern suggests that if Nifty crosses and sustains above 11060 level it would witness buying which would lead the index towards 11100-11130 levels. Important Supports for the day is around 10980 However if index sustains below 10980 then it may witness profit booking which would take the index towards 10950-10900 levels. Nifty is trading above 20, 50 and 100 day SMA's which are important short term moving averages, indicating positive bias in the short to medium term. The daily strength indicator RSI and momentum oscillator Stochastic have both turned negative and are below their respective reference lines indicating negative bias. The trend deciding level for the day is 11005. If NIFTY trades above this level then we may witness a further rally up to 11130-11245-11370 levels. However, if NIFTY trades below 11005 levels then we may see some profit booking initiating in the market, which may correct up to 10890-10765-10655 levels. Stocks to focus for intraday Long Escorts, Jktyre, Iciciprili, Jswsteel, UBL, Ceat, Jetairways, Siemens Stocks to focus for intraday Short Titan, Deepakfert, Sunpahrma, Tvsmot, Dhfl
