Download
1 / 1
10 likes | 18 Views
Axis Direct presents daily derivatives report presenting recommendations based on technical analysis. For trading in derivatives visit https://simplehai.axisdirect.in/offerings/products/derivatives<br>https://simplehai.axisdirect.in/share-stock-prices/nse/Lupin-Ltd-3026<br>https://simplehai.axisdirect.in/share-stock-prices/nse/Cipla-Ltd-114<br>

E N D
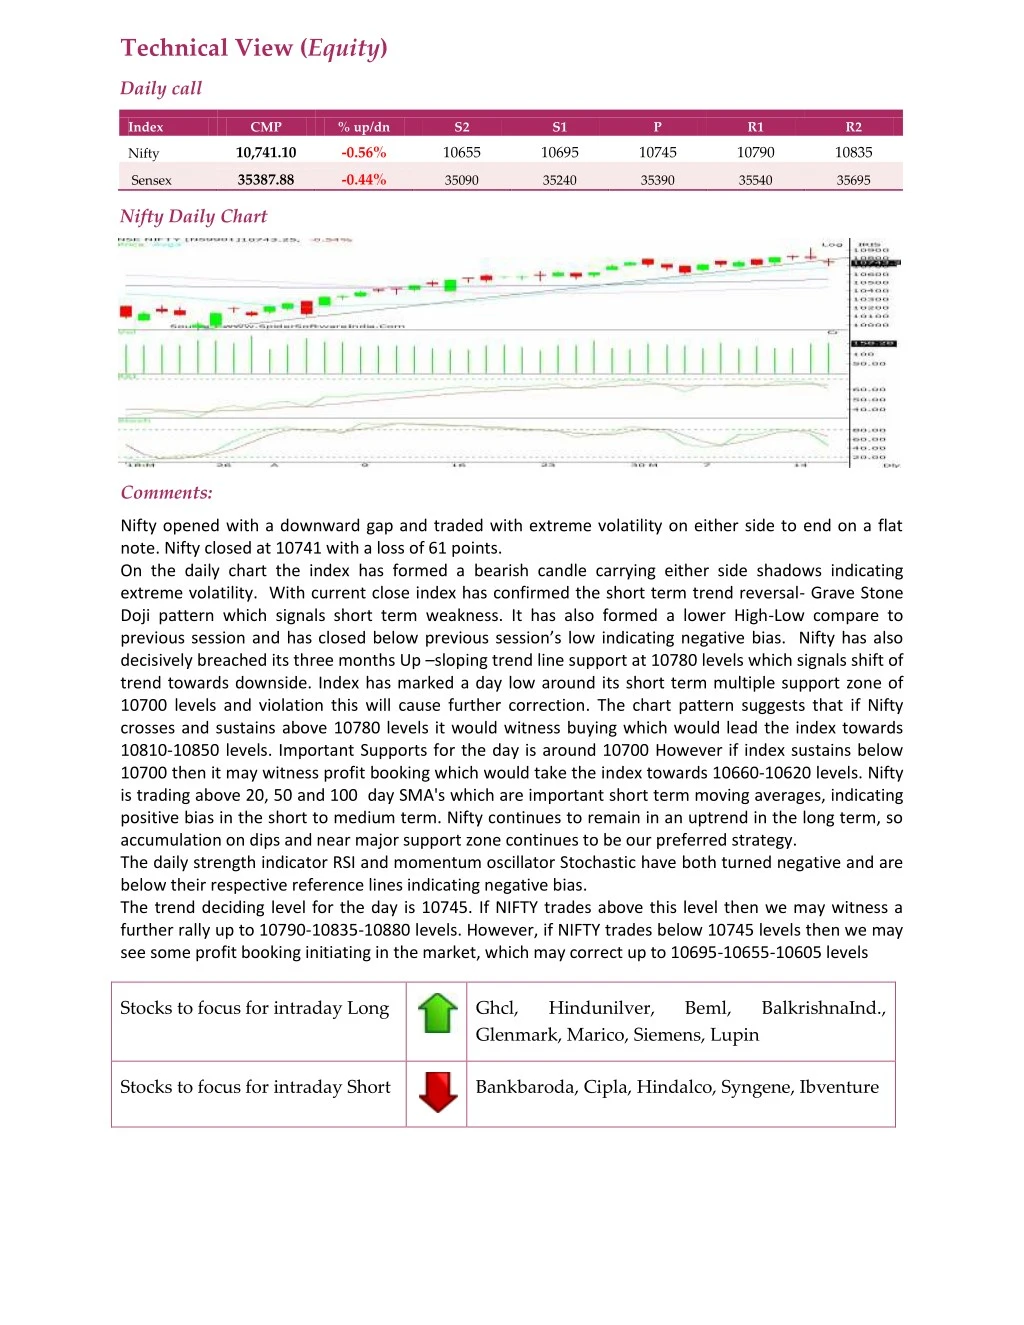
Technical View (Equity) Daily call Index CMP % up/dn S2 S1 P R1 R2 10,741.10 -0.56% 10655 10695 10745 10790 10835 Nifty 35387.88 -0.44% Sensex 35090 35240 35390 35540 35695 Nifty Daily Chart Comments: Nifty opened with a downward gap and traded with extreme volatility on either side to end on a flat note. Nifty closed at 10741 with a loss of 61 points. On the daily chart the index has formed a bearish candle carrying either side shadows indicating extreme volatility. With current close index has confirmed the short term trend reversal- Grave Stone Doji pattern which signals short term weakness. It has also formed a lower High-Low compare to previous session and has closed below previous session’s low indicating negative bias. Nifty has also decisively breached its three months Up –sloping trend line support at 10780 levels which signals shift of trend towards downside. Index has marked a day low around its short term multiple support zone of 10700 levels and violation this will cause further correction. The chart pattern suggests that if Nifty crosses and sustains above 10780 levels it would witness buying which would lead the index towards 10810-10850 levels. Important Supports for the day is around 10700 However if index sustains below 10700 then it may witness profit booking which would take the index towards 10660-10620 levels. Nifty is trading above 20, 50 and 100 day SMA's which are important short term moving averages, indicating positive bias in the short to medium term. Nifty continues to remain in an uptrend in the long term, so accumulation on dips and near major support zone continues to be our preferred strategy. The daily strength indicator RSI and momentum oscillator Stochastic have both turned negative and are below their respective reference lines indicating negative bias. The trend deciding level for the day is 10745. If NIFTY trades above this level then we may witness a further rally up to 10790-10835-10880 levels. However, if NIFTY trades below 10745 levels then we may see some profit booking initiating in the market, which may correct up to 10695-10655-10605 levels Stocks to focus for intraday Long Ghcl, Glenmark, Marico, Siemens, Lupin Hindunilver, Beml, BalkrishnaInd., Stocks to focus for intraday Short Bankbaroda, Cipla, Hindalco, Syngene, Ibventure
