Download

1 / 22
250 likes | 529 Views
Survivorship Curves and Demographics. Biologists often study populations of organisms. We want to compare and contrast survivorship curves for three different species. Compare and Contrast. This graph compares the survivorship curves of three species. Humans Hydras and

E N D
Biologists often study populations of organisms We want to compare and contrast survivorship curves for three different species
Compare and Contrast This graph compares the survivorship curves of three species • Humans • Hydras and • Oysters
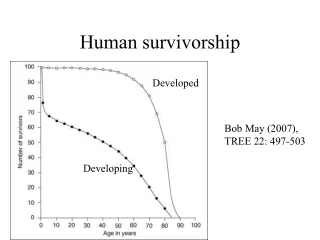
Humans exhibit a Type I Survivorship Curve Type I Humans Number Surviving Time
A group of humans born in the same year make up a cohort Type I Humans Number Surviving Time Most members of a human cohort tend to survive for many yearsand then most members of that cohort die late in life
Oysters exhibit a Type IIISurvivorship Curve Number Surviving Time The graph shows that most members of a cohort of oyster larvae are eaten by predators in their first days of life Most that survive this dangerous period, however, grow shells and tend to live a long life
Hydras exhibit a Type IISurvivorship Curve Number Surviving Time The graph shows that members of a cohort of hydras in a pond die at a relatively constant rate throughout life Grazers and predators simply consume them whenever they are discovered
Other Parameters of a Population Birth Rates and Death Rates are important population parameters
Demographic Parameters Among humans, for example, approximately 365,000 births take place around the world on an average day
Demographic Parameters During the same 24 hours, there areapproximately 155,000 deaths worldwide We can update these numbers at www.census.gov
Demographic Parameters If the number of births and deaths each year are equal Population Size .Time the size of a population remains stable
If the number of births over time exceedsthe number of deaths as is happening todayinour own population then a population grows larger and larger
If we subtract births per day minus deaths per day 365,000 155,000 We obtain a population’s rate of Net Increase
What is our current rate of net increase? 365,000 155,000 + 210,000 … per day …
There are approximately 210,000 extra persons inhabiting our planet each day
In what way is knowledge of births, deaths,and net increase important? • Food • Schools • Jobs • Taxes • The environment ?
If today is Friday,by this same time on Monday, Earth will be home to 630,000 additional human beings Friday to Saturday = + 210,000 Saturday to Sunday = + 210,000 Sunday to Monday = + 210,000
Hopefully, someone, somewhere is planning to grow a lot of extra food over the weekend
Monday Through Friday We have just calculated humanity’s current daily rates of net increase … + 210,000each day … Next If today is Monday, how many additional people willinhabit our planet by this same time on Friday? Answer + 840,000
? ? ? ? Assuming our current pace continues unabated into the future, and assuming 25 students in an average classroom, how many additional classrooms does this pace necessitate every four days?