Download
1 / 21
220 likes | 483 Views
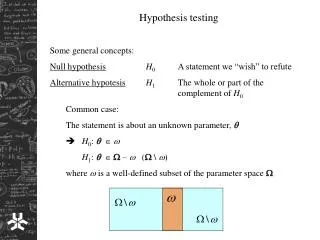
Components of an Ecological Research Program. OBSERVATIONS Pattern in Space or Time. MODELS Explanations or Theories. HYPOTHESIS Predictions based on model. NULL HYPOTHESIS Logical Opposite to Hypothesis. EXPERIMENT Critical test of Null Hypothesis. Retain H o Refute hypothesis

E N D
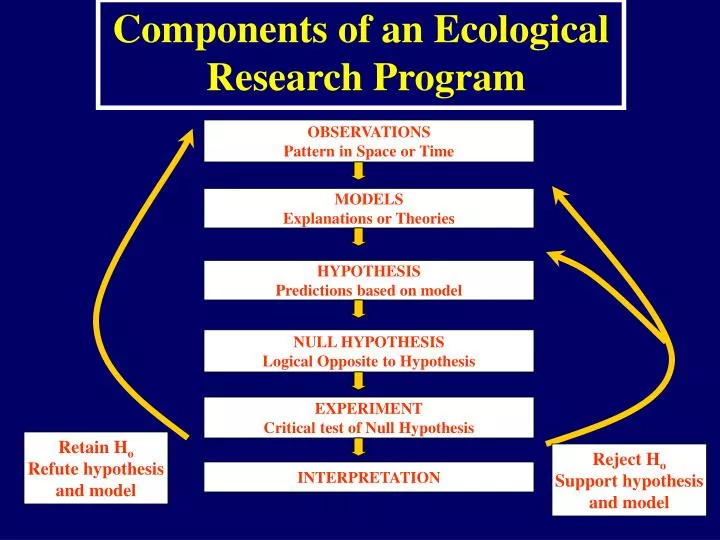
Components of an Ecological Research Program OBSERVATIONS Pattern in Space or Time MODELS Explanations or Theories HYPOTHESIS Predictions based on model NULL HYPOTHESIS Logical Opposite to Hypothesis EXPERIMENT Critical test of Null Hypothesis Retain Ho Refute hypothesis and model Reject Ho Support hypothesis and model INTERPRETATION
Types of Evidence Non-Experimental Research Data dredging (Meta-analysis) Sampling (Recon, pilot study, sample size placement and number) Experimental Research Natural experiments Mensurative experiments Manipulative experiments -Pulse and press
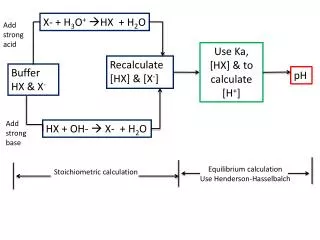
Introduction • Statistically synthesizing the findings of independent experiments is known as meta-analysis. • Meta-analysis combines results of two or more studies to reach an conclusion about the magnitude of a treatment effect. • Three major approaches are: vote counting, combining significance levels (p-values), and combining estimates of effect size (r-family, d-family, odds ratios).
Carrying out a meta-analysis 1. Form hypotheses first 2. Identify relevant studies 3. Establish study inclusion / exclusion criteria 4. Extract and code study data 5. Data analysis & interpretation 6. Results and conclusion
Before You Begin a Meta-analysis Remember that…. • A meta-analysis is only as good as its data. Incomplete reporting, lack of independence, and publication or research bias are important issues. Studies that don’t report sample size and variance can’t be included in most meta-analyses. • Studies from the same lab may lack independence. Bias may also exist when significant studies are published more than non-significant ones. • Researchers may also choose to study organisms or systems which are more likely to show effects.
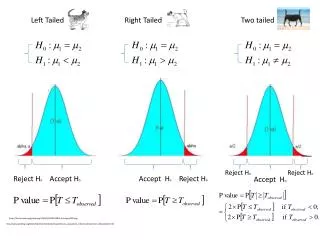
Vote counting • Vote counting tallies the number of instances that are consistent or inconsistent with an hypothesis. Conclusions are subjective, and based on a decision that the observed proportions are exceptionally high (a binomial test could also be used). • Problems are: one can define a positive vote in different ways; and all studies are treated equally (i.e., a study with n= 2 is equal to a highly replicated study, and a study with small effects is treated as equal to one with large effects). • If only the existence and direction of an effect is reported, vote counting is the only way to proceed.
Combining Significance Levels • When only p-values are reported, tests based on combining significance values from a statistical test can be used to synthesize results. Several tests of combined significance can be used, but Fisher’s method is most common. • The problem with combining probabilities is that the same probability calculated from different studies could arise if one study had a large sample size and a small effect size, and another study had a large effect size and a small sample size. Hence, the overall test is only for statistical significance and provides no information on the average magnitude of the treatment effect.
Combining Estimates of Effects Sizes • Combining effect sizes is the best way to use meta-analysis, since effects sizes can be weighted in proportion to their variance, and sample sizes. • The effect size reflectsdifferences between experimental and control groups. The outcome of each study is calculated as an index of effect size and indices are summarized across studies • Two families of effect size measures-- the d family and the r family--are used for continuous variables. The odds ratio is used with categorical data
Types of Evidence Non-Experimental Research Data dredging (Meta-analysis, Macroecology and Null Models) Sampling (Recon, pilot study, sample size placement and number) Experimental Research Natural experiments Mensurative experiments Manipulative experiments -Pulse and press
Principles for Environmental Studies • Clearly state the question being asked. Results will only be as coherent as the initial conception of the problem • Take replicate samples within each combination of time, location and other controlled variables. Differences among can only be demonstrated by comparisons to differences within • Take equal numbers of randomly allocated samples for each combination of controlled variables. Sampling in “representative” or “typical” areas is not random sampling.
Principles for Environmental Studies -2 • To test whether a condition has an effect, collect samples both where the condition is present and where it is absent but all else is the same. An effect can only be demonstrated by comparison with a control. • Verify that your sampling method is sampling the population you think your are sampling with equal and adequate efficiency over the entire range of conditions to be encountered. Variation in efficiency among areas biases comparisons.
Principles for Environmental Studies-3 • If the study area has large scale heterogeneities, break the area into homogeneous sub areas (strata) and allocate samples to each in proportion to the size of, or the number of organisms in, the sub area. • Verify that your sample unit size is appropriate to the sizes, densities and spatial distributions of the organisms you are sampling. Then estimate the number of replicate samples required to obtain the precision you want.
Types of Evidence Non-Experimental Research Data dredging (Meta-analysis) Sampling (Recon, pilot study, sample size placement and number) Experimental Research Natural experiments Mensurative experiments Manipulative experiments -Pulse and press
Types of Evidence Non-Experimental Research Data dredging (Meta-analysis) Sampling (Recon, pilot study, sample size placement and number) Experimental Research Natural experiments Mensurative experiments Manipulative experiments -Pulse and press
Types of Evidence Non-Experimental Research Data dredging (Meta-analysis) Sampling (Recon, pilot study, sample size placement and number) Experimental Research Natural experiments Mensurative experiments Manipulative experiments -Pulse and press
Pitfalls in Manipulative Ecological Experimentation • Artifacts (cage effects)- e.g., increased larval settlement inside predator exclusion cages • Pseudoreplication- occurs when replicates are not independent or when no replication exists • Changes in controls- can occur due to natural variability
Trade Offs Among ExperimentalApproaches to Testing Hypotheses Types of Experiments Lab Field Natural Factors Variable Control High High None Site Matching High Medium Low Tracking Change Yes Yes Yes Duration Short Short Long Spatial Variability Least Medium Highest Realism None/ Low High Highest Generality None Low Highest