Download
1 / 23
230 likes | 427 Views
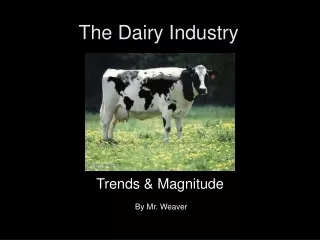
Dairy Industry Trends and Opportunities. John F. Smith Extension Dairy Specialist Kansas State University. Percent of U.S. Milk Production for Different Herd Sizes. >200 cows = 57%. Percent of U.S. Inventory (cows) for Different Herd Sizes. >200 = 51%.

E N D
Dairy Industry Trends and Opportunities John F. Smith Extension Dairy Specialist Kansas State University
Percent of U.S. Milk Production for Different Herd Sizes >200 cows = 57%
Percent of U.S. Inventory (cows) for Different Herd Sizes >200 = 51%
Number of Operations for Different Herd Sizes in the US <200 = 89,570 Herds >200 = 7990 herds (8.2%)
Percent of U.S. Milk Production from Dairies with > 200 Cows Source: USDA-NASS
Two Ways to Increase Milk Production • Milk More Cows • Increase Milk Production per Cow • Operations over 200 cows are doing both
Pounds of Feed (DM Basis) Required* For Maintenance at Different Levels of Peak Milk Production 104 96 86 Pounds of Feed Pounds of Milk 13 13 13 * Assumes a ration containing 0.78 Mcal/lb of dry matter * Assumes environmental factors are constant.
Total number of milk cows and milk production per cow on dairy farms in the United States 90’s + 2989 lb/c/y 80’s + 2432 lb/c/y Compiled from: USDA Statistical Bulletin 303, 430 USDA Statistical Bulletin Entitled Milk: Final Estimates for Various Issues.
Other Industry Trends • Many producers are building new facilities • Upgrading existing facilities • New facilities • Urban encroachment is encouraging producers to relocate creating new dairy pockets • ID,NM,TX,KS,IA,IN,MI • Tax implications
Total Milk Production by Region of the United States Adapted from: U.S. Dairy Industry Statistics 1900-99. Hoards West. April 25, 2000. Pg 50-51.
Other Industry Trends • Significant Premiums for Shipping a Tanker of Milk • $0.10-1.80 cwt. • Dilute Fixed Assets over as Many Cows as Possible • Milking parlor & Manure mgt. • Manage Employees • Partnerships & Business Structures • Combining Resources • Increase in the Number of Multiple Unit Operations
Where will the Cows Go? • Social Acceptance • Environmental Pressure • Large Tracts of Land • Quality of Life • Climate • Both Cold & Hot • Economic Incentives • Milk Market • Local Incentives
Potential Locations for New Dairies • Big 3-CA, ID, NM • High Plains-SD, NE, KS • Eastern Oregon • Panhandle of TX & OK • I-29 Corridor-SD, MN, IA, NE, KS, MO • Tri-State Area-IL, IN, OH • Upper Midwest • Western New York • Utah, Nevada, Montana & Wyoming
Who’s Building These New Dairies? • Expansion of Existing Operations • Relocations • CA • Other States • Immigrants • Unknown Entities or Investor Groups • Business Structure Changes
Limitations to Expansion or Relocation • Capable Managers • Ability to Obtain Permits • Clear Definition of Requirements • Permits Held Up in Court • Social Acceptance • Technical Support • Engineers, Contractors, Technicians, Management Specialist
Effect of Herd Size on Annual Ownership Costs Per Cow for a Double-8 Herringbone Source: Craig Thomas, Michigan State University
Investment in Facilities and Livestock KSU: Dairy enterprise budgets, 2001
Summary • The dairy industry at the farm level is consolidating very rapidly. • 8.2% of the herds produce 57% of the milk 51% of the cows • New dairy pockets are developing rapidly • Relocating dairies • Expansion of existing dairies
Summary • Business structures are changing • Dilute the cost of facilities over as many cows as possible • Shortage of people with the management skills needed to run a large dairy • Limited number of places where large dairies can be built • Volume and quality premiums