Download
1 / 25
250 likes | 394 Views
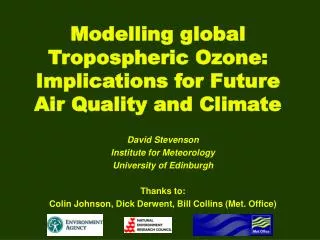
Global Modelling of UTLS Ozone. David Stevenson + many others dstevens@staffmail.ed.ac.uk www.geos.ed.ac.uk/homes/dstevens Institute of Atmospheric and Environmental Science The University of Edinburgh. Royal Met. Soc. 18 th October 2006, London Zoo.

E N D
Global Modelling of UTLS Ozone David Stevenson + many others dstevens@staffmail.ed.ac.uk www.geos.ed.ac.uk/homes/dstevens Institute of Atmospheric and Environmental Science The University of Edinburgh Royal Met. Soc. 18th October 2006, London Zoo
Very few observations of long-term trends in tropospheric ozone…
Surface ozone at Arosa, Switzerland Staehelin et al., 2001
Largeinterannualvariability Even shorter time period of observationsfrom the free atmosphere… NH mid-lats, mid-troposphere Regionallydifferent trends;regionallydifferent AQmeasures Logan et al., 1999; O3 sonde data
Models of tropospheric ozone • Limited observational evidence suggests that O3T has increased substantially since pre-industrial times • No ice-core record of O3 (too reactive) • Recent (last 30 years) trends show regional differences and are obscured by large interannual variations • We are dependent on models to produce a global picture of O3T change (past and future) • Best we can do is produce models that closely match the limited set of observations of O3 and its precursors, and hope they can reliably simulate the past/future • But it is difficult to know the true ‘ozone sensitivity’ – i.e. O3/emissions or O3/climate • However, we can assess the consistency (or otherwise) between models – i.e. intercomparisons
Zonal mean O3 change Trop. O3 radiative forcing 1860-1990 O3 (Stevenson et al., 1998) Tropospheric O3 radiative forcing • Simulate pre-industrial and present-day O3T,use the change to calculate a radiative forcing • A large part of this is due to changes in UT O3 15-40°N: Cold, high tropopause, hot surface, clear skies
Warming from increasesin GHGs +3 W m-2 About ¼ of CO2 forcing
A commonly held view? • “Nobody believes a modelling paper except the author; everybody believes an observational paper – except the author” • One solution…
ACCENT model intercomparison for IPCC-AR4 • 26 different models perform same experiments • 16 Europe: • 4 UK (Edinburgh, Cambridge x2, Met. Office) • 4 Germany (Hamburg x2, Mainz x2) • 2 France (Paris x2) • 2 Italy (Ispra, L’Aquila) • 1 Switzerland (Lausanne) • 1 Norway (Oslo) • 1 Netherlands (KNMI) • 1 Belgium (Brussels) • 7 US • 3 Japan • Large ensemble reduces uncertainties, and allows them to be quantified
Intercomparison simulations • Year 2000 – using EDGAR3.2 emissions • Fix biomass burning & natural emissions • 3 Emissions scenarios for 2030 • ‘Likely’: IIASA CLE (‘Current Legislation’) • ‘High’: IPCC SRES A2 • ‘Low’: IIASA MFR (‘Maximum technically Feasible Reductions’) • Also assess climate feedbacks • expected surface warming of ~0.7K by 2030
Comparison of ensemble mean model with O3 sonde measurements Individualmodels in grey UT250 hPa Model ±1SD Observed ±1SD J F M A M J J A S O N D MT 500 hPa LT 750 hPa 30°S-Eq 30°N-Eq 90-30°N 90-30°S
GOME NO2 Tropospheric Column 2000 Mean of 3 retrieval methods Std. Dev. of 3 retrieval methods Mean of 17 models Std. Dev. of 17 models E. Asian NOx emissions too low; Biomass burning emissions too high
Models’ CO underestimates observations in Northern Hemisphere- Asian CO emissions too low
Where is modelled O3T most uncertain? Zonal mean year 2000 O3T
Year 2000 Ensemble meanof 26 models AnnualZonalMean Annual TroposphericColumn
Year 2000 Inter-model standard deviation (%) AnnualZonalMean Annual TroposphericColumn Models show large variationsin the crucial tropical UT region
Change in tropospheric O32000-2030 under 3 scenarios Annual Zonal Mean ΔO3 / ppbv Annual Tropo-spheric Column ΔO3 / DU ‘Optimistic’ IIASA MFR SRES B2 economy + Maximum Feasible Reductions ‘Likely’ IIASA CLE SRES B2 economy + Current AQ Legislation ‘Pessimistic’ IPCC SRES A2High economic growth +Little AQ legislation
Main candidates for inter-model differences in tropical UT O3 • Convection • Vertical mixing of both O3 and its precursors • Lightning NOx production • In-cloud chemistry, washout • Distribution of water vapour • Different treatments of emissions • Injection height of biomass burning • Biogenic VOCs and degradation chemistry • Lightning NOx (magnitude/profile) • Stratosphere-troposphere exchange • All of above also sensitive to climate change…
Convection increases ozone everywhere MATCH-MPIC (Lawrence et al., 2003) Effect of switching on convection in 2 models Convection increases ozone in tropical MT Decreases elsewhere STOCHEM-HadAM3 (Doherty et al., 2005) We don’t know what convectiondoes to UT O3 !
Convective mass fluxes differ markedly STOCHEM-HadAM3; Too strong/high? Or are differencesin the chemical schemes the causeof the differences? ERA-40The truth? MATCH-MPIC Too weak/low?
Positive stratosphericinflux feedback Negative watervapour feedback Impact of Climate Change on Ozone by 2030(ensemble of 10 models) Mean + 1SD Mean - 1SD Mean Positive and negative feedbacks – no clear consensus
Climate impact of aircraft NOx emissions Short-term warming from ozone Plus minor ozone long-term cooling Long-term cooling from methane ΔNOx NB negative scale expanded ΔO3 NB negative scale expanded ΔOH ΔCH4 Decay with e-folding timescale of 11.1 years UT crucial for correct quantification of aircraft NOx impacts…
Summary • Models are essential to simulate past/future ozone (lack of observations) • Comparison of models and observations suggest similar levels of uncertainty in both • Uncertainties in modelled O3 are large in the UT – translates directly into climate forcing • Convection is poorly understood and a major source of uncertainty – not even clear if convection increases or decreases UT O3 • Likely effects of climate change (water vapour increases, STE changes) on O3 even less well constrained • Conclusion: plenty to do… dstevens@staffmail.ed.ac.uk www.geos.ed.ac.uk/homes/dstevens