Download
1 / 19
190 likes | 337 Views
Low-Level Cloud Variability Over the Equatorial Cold Tongue in Observations and GCMs. David Mansbach and Joel Norris Scripps Institution of Oceanography 21 March 2006. Outline. Large interannual low-level cloud variability occurs over the equatorial cold tongue.

E N D
Low-Level Cloud Variability Over the Equatorial Cold Tongue in Observations and GCMs David Mansbach and Joel Norris Scripps Institution of Oceanography 21 March 2006
Outline • Large interannual low-level cloud variability occurs over the equatorial cold tongue. • Advection over an SST gradient is a dominant factor controlling low-level cloud (e.g., Deser et al. 1993). • The advection effect opposes the SST/LTS effect on cloudiness over the southern side of the cold tongue. • The differing influence of advection and SST/LTS on low-level cloudiness provides a good opportunity to evaluate GCM boundary layer cloud simulations.
Observational Data and Methods • Monthly mean daytime low-level cloud amount from ISCCP D2 adjusted for overlap by higher clouds • Meteorological parameters from NCEP/NCAR reanalysis • Ship synoptic reports from Hahn and Warren Extended Edited Cloud Report Archive (EECRA) • Soundings from EPIC transects in 1999 and 2001 • Examine June-November cool season during 1983-2001 • Define “SST advection” as −V1000·SST
Climatology and Interannual Variability ISCCP low-level cloud amount mean (lines) and standard deviation of monthly anomalies (color) SST mean (lines) and standard deviation of monthly anomalies (color)
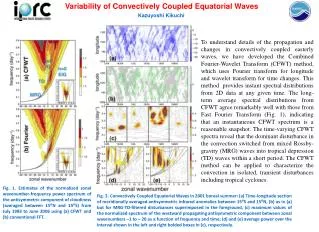
Relationships with Low-Level Cloud cloud and SST correlation cloud and SST advection correlation light gray = 95% significant dark gray = 99% significant
Relationships with Low-Level Cloud SST and SST advection correlation Additional variance explained by regressing on SST advection in addition to SST
Warm and Cold Advection Composites COLD MINUS WARM ANOMALY FIELDS ANOMALOUSLY COLD ADVECTION ANOMALOUSLY WARM ADVECTION Plots are averaged over lower and upper terciles of monthly anomalies of SST advection in the designated region.
Warm and Cold Advection Zonal Means averaged over 95-105°W red = warm anomalous SST advection tercile blue = cold anomalous SST advection tercile less cloud amount on southern side of cold tongue for warm SST advection opposite response on northern side of cold tongue latitude
Warm and Cold Advection Zonal Means on southern side of cold tongue, warm SST advection is related to: more clear sky more Sc, St less Cu, Cu/Sc latitude latitude
Warm and Cold Advection Zonal Means on southern side of cold tongue, warm SST advection is related to: colder SST higher RHsfc weaker windsfc less negative air-sea T diff latitude latitude
Warm and Cold Advection Soundings on southern side of cold tongue, warm SST advection is related to: shallower atmospheric boundary layer lower RH near boundary layer top latitude latitude
Observational Summary South of the Equator strong cold tongue air flows over relatively colder water surface layer becomes stratified upward mixing of moisture is inhibited cloudiness is not sustained against subsidence and entrainment warming weak cold tongue air flows over water of similar temperature surface layer not stratified upward mixing of moisture is not inhibited cloudiness is sustained against subsidence and entrainment warming North of the Equator strong cold tongue air flows over much warmer water surface layer becomes very destabilized much cloudiness is generated weak cold tongue air flows over warmer water surface layer becomes destabilized some cloudiness is generated
Evaluation of GCM output • Atmosphere-only AMIP runs with prescribed historical SST for NCAR CAM3 and GFDL AM2 • Coupled atmosphere-ocean runs from NCAR CCSM3 and GFDL CM2.0, CM2.1 • Coupled model output is difficult to evaluate since cloud, SST, and wind distributions substantially differ from the observed distributions
Climatology and Interannual Variability GFDL AM2 Observed NCAR CAM3
Low-Level Cloud – SST Correlation GFDL AM2 Observed NCAR CAM3
Cloud - SST Advection Correlation GFDL AM2 Observed NCAR CAM3
Additional Variance due to SST Advection Observed GFDL AM2 NCAR CAM3
Mean temperature advection Mean low cloud anomaly (%) Dataset and Longitude range anomaly (K/day) Anomalously Anomalously Anomalously Anomalously cool advection warm cool advection warm S of Eq advection S of Eq S of Eq advection S of Eq ISCCP + reanalysis, 0.76 -0.53 -3.9 0.8 Eq-5N 110-90W -0.59 0.56 3.3 -5.1 5S-Eq GFDL AM2 110- 0.65 -0.44 -4.6 1.1 Eq-5N 90W -0.37 0.35 1.8 -3.4 5S-Eq NCAR CAM3 110- 0.88 -0.62 -5.4 3.7 Eq-5N 90W -0.47 0.45 -5.5 4.3 5S-Eq 0.54 -0.52 11.1 -14.2 Eq-5N CCSM3 130-110W -1.32 1.40 10.5 -11.9 5S-Eq 0.13 -0.05 5.6 -5.7 Eq-6N GFDL CM2.0 105-125W -0.51 0.43 -1.1 1.3 6S-Eq 0.23 -0.22 16.4 -11.0 Eq-6N GFDL CM2.1 130-90W -0.92 0.77 3.2 -2.2 6S-Eq 0.18 -0.13 2.8 -4.3 Eq-5N CCSM3 110-90W -0.19 0.18 2.6 -4.0 5S-Eq 0.00 0.02 2.3 -2.7 Eq-6N GFDL CM2.0 110-90W -0.21 0.18 0.5 0.3 6S-Eq -0.19 0.44 7.5 -10.1 Eq-6N GFDL CM2.1 110-90W -0.29 0.28 2.8 -3.0 6S-Eq
Conclusions • The GFDL AM2 reproduces the observed cloud-advection relationship when provided with prescribed historical SST, but the NCAR CAM3 does not. • The GFDL and NCAR coupled atmosphere-ocean models do not reproduce the observed cloud-advection relationship, perhaps because the simulated eastern equatorial Pacific is too unrealistic. • The cloud-advection relationship on the southern side of the cold tongue is a good diagnostic for GCM boundary layer cloudiness since it opposes the SST/LTS-cloud relationship.