Download
1 / 22
220 likes | 339 Views
Partnerships for Land Cover Data Development in the Lower Columbia River. Chris Robinson, I.M. Systems Group at the. NOAA Coastal Services Center. Keith Marcoe Lower Columbia River Estuary Partnership Nate Herold NOAA Coastal Services Center.

E N D
Partnerships for Land Cover Data Development in the Lower Columbia River Chris Robinson, I.M. Systems Group at the NOAA Coastal Services Center Keith Marcoe Lower Columbia River Estuary Partnership Nate Herold NOAA Coastal Services Center
Lower Columbia River Estuary Partnership (LCREP) • One of 28 National Estuary Programs • Public-Private, 501c (3) Non – Profit Organization • Estuarine and tidally influenced area
NOAA Coastal Change Analysis Program (C-CAP) • National mapping framework • Moderate Res: Coastal U.S. 1996, 2001 and 2006 • High Res: Hawaii, USVI, Pacific and Caribbean Territories • LRCEP contacted NOAA as RFP was released
LCREP and C-CAP Collaboration • High resolution data set for same price • Guidance on methodology • Classification Scheme development • Sanborn Solutions (Portland, OR) performed mapping • Provided QA of contract deliverables
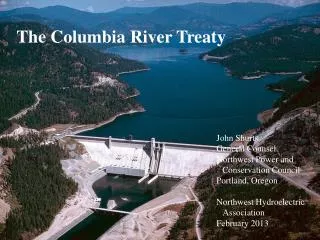
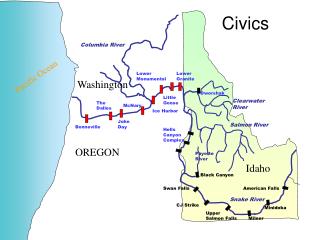
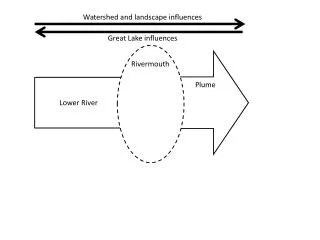
Project Area from River Mile (RM) 0 at the river’s mouth to RM 145 below the Bonneville Dam and laterally from the Columbia River to the historic floodplain boundary
Classification Scheme LCREP C-CAP
Data Inputs – Lidar • Acquired during 2009-2010 • US Army Corps of Engineers • Bare Earth and 1st Returns • Estimated Canopy Heights
Data Inputs – Ancillary Data • National Wetlands Inventory (NWI) • Soils - SURRGO • Landsat Imagery
Methods– Image Segmentation • High spatial resolution imagery • eCognition • Spectrally and texturally homogenous regions • Multiple Scales • Feature Variables
Methods– Field Data Collection • Collected March – September 2010 • Sanborn/SWCA Environmental Consultants • Broad distribution • Segment as sampling unit • Split into Training and Validation
Methods– Classification and Regression Tree Analysis (CART) • Predicts discrete categories (land cover) • Handles continuous and nominal data • Uses training data to mine relationships from input data stack • Generates interpretable rule sets (decision tree) • Applied to independent variables for map creation • Does require a lot of training data
Methods– Automated Classification MMU – 0.25 acres
Methods– Tidal/Diked Layer • Stratifies project area into Tidal, Non-Tidal, Tidally impaired, Fill and Uncertain • MHHW estimate (NAVD88) • Varied MHHW surface from RM45 upriver to incorporate Dam discharge (Based on data from NOAA Stations) • Compare to Lidar elevations • Apply ancillary data for impairments
Methods– Modeling and Manual Edits • Even well executed automated classifications can contain errors • To meet spec additional modeling to refine classes • Herbaceous wetlands • Manual edits to address site specific errors • Tidal/Diked Layer applied to finalized Land Cover map
Methods– Accuracy Assessment Courtesy of Sanborn Mapping Company
Crosswalk and Refinement for C-CAP • Re-label categories that directly translate • Separation of Palustrine and Estuarine Wetlands (Field Data and NWI) • Distinction between Pasture and Cultivated Lands • Extract Mudflats from Sand class • Remap Impervious Surfaces and Open Space Developed at a finer minimum mapping unit (0.1 acres)
Challenges/Lessons Learned Variability in acquisition times of imagery Difficult to extend signatures and model thresholds Processing time for 1m imagery Also impacts Data Distribution Deriving wetlands from 4 Band imagery (No Mid IR) Relied on Lidar, Soils and NWI
Conclusion Land cover met the needs of both partners LCREP have the means to complete their Ecological Classification C-CAP was able to add another dataset to their High Resolution product line C-CAP version currently served through NOAA CSC Digital Coast website Adding a new which highlights LCREP project and data
Questions? Chris.Robinson@noaa.gov NOAA CSC Digital Coast http://www.csc.noaa.gov/digitalcoast/