Download
1 / 38
380 likes | 631 Views
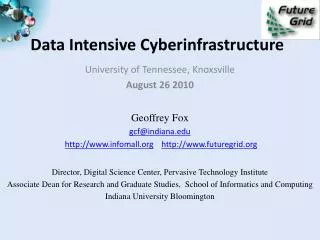
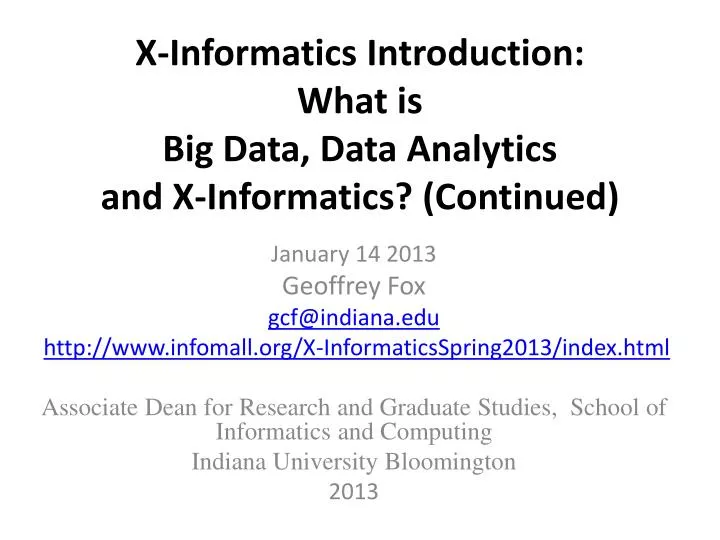
X-Informatics Introduction: What is Big Data, Data Analytics and X-Informatics? (Continued). January 14 2013 Geoffrey Fox gcf@indiana.edu http:// www.infomall.org/X-InformaticsSpring2013/index.html Associate Dean for Research and Graduate Studies, School of Informatics and Computing

E N D
X-Informatics Introduction:What isBig Data, Data Analytics and X-Informatics? (Continued) January 14 2013 Geoffrey Fox gcf@indiana.edu http://www.infomall.org/X-InformaticsSpring2013/index.html Associate Dean for Research and Graduate Studies, School of Informatics and Computing Indiana University Bloomington 2013
Sensors (Things) as a Service Output Sensor Sensors as a Service Sensor Processing as a Service (could useMapReduce) A larger sensor ……… https://sites.google.com/site/opensourceiotcloud/ Open Source Sensor (IoT) Cloud
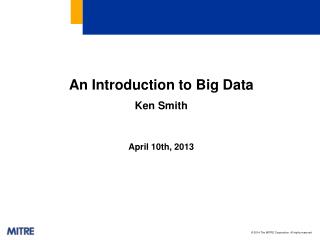
The Microsoft Cloud is Built on Data Centers ~100 Globally Distributed Data Centers Range in size from “edge” facilities to megascale (100K to 1M servers) Quincy, WA Chicago, IL San Antonio, TX Dublin, Ireland Generation 4 DCs Gannon Talk
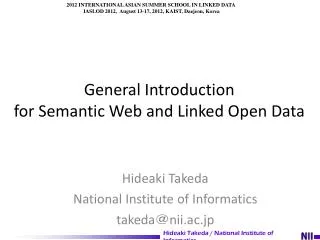
Data Centers Clouds & Economies of Scale I Range in size from “edge” facilities to megascale. Economies of scale Approximate costs for a small size center (1K servers) and a larger, 50K server center. Each data center is 11.5 times the size of a football field 2 Google warehouses of computers on the banks of the Columbia River, in The Dalles, Oregon Such centers use 20MW-200MW (Future) each with 150 watts per CPU Save money from large size, positioning with cheap power and access with Internet
Data Centers, Clouds & Economies of Scale II • Builds giant data centers with 100,000’s of computers; ~ 200-1000 to a shipping container with Internet access • “Microsoft will cram between 150 and 220 shipping containers filled with data center gear into a new 500,000 square foot Chicago facility. This move marks the most significant, public use of the shipping container systems popularized by the likes of Sun Microsystems and Rackable Systems to date.”
Green Clouds • Cloud Centers optimize life cycle costs and power use • http://www.datacenterknowledge.com/archives/2011/05/10/uptime-institute-the-average-pue-is-1-8/ • Average PUE = 1.8 (was nearer 3) ; Good Clouds are 1.1-1.2 • 4th generation data centers (from Microsoft) make everything modular so data centers can be built incrementally as in modern manufacturing • http://loosebolts.wordpress.com/2008/12/02/our-vision-for-generation-4-modular-data-centers-one-way-of-getting-it-just-right/ • Extends container based third generation
Some Sizes in 2010 • http://www.mediafire.com/file/zzqna34282frr2f/koomeydatacenterelectuse2011finalversion.pdf • 30 million servers worldwide • Google had 900,000 servers (3% total world wide) • Google total power ~200 Megawatts • < 1% of total power used in data centers (Google more efficient than average – Clouds are Green!) • ~ 0.01% of total power used on anything world wide • Maybe total clouds are 20% total world server count (a growing fraction)
Some Sizes Cloud v HPC • Top Supercomputer Sequoia Blue Gene Q at LLNL • 16.32 Petaflop/s on the Linpack benchmark using 98,304 CPU compute chips with 1.6 million processor cores and 1.6 Petabyte of memory in 96 racks covering an area of about 3,000 square feet • 7.9 Megawatts power • Largest (cloud) computing data centers • 100,000 servers at ~200 watts per CPU chip • Up to 30 Megawatts power • Microsoft says upto million servers • So largest supercomputer is around 1-2% performance of total cloud computing systemswith Google ~20% total
Clouds Offer From different points of view • Features from NIST: • On-demand service (elastic); • Broad network access; • Resource pooling; • Flexible resource allocation; • Measured service • Economies of scale in performance and electrical power (Green IT) • Powerful new software models • Platform as a Service is not an alternative to Infrastructure as a Service – it is instead an incredible valued added • New programming ideas including MapReduce and new storage ideas like NOSQL, Bigtable etc. designed for Big Data as invented by Google and internet companies to solve Cloud applications like information retrieval, e-commerce and Social Media
Bina Ramamurthy http://www.cse.buffalo.edu/~bina/cse487/fall2011/
Bina Ramamurthy http://www.cse.buffalo.edu/~bina/cse487/fall2011/
Bina Ramamurthy http://www.cse.buffalo.edu/~bina/cse487/fall2011/
Semantic Web/Grid v. Big Data • Original vision of Semantic Web was that one would annotate (curate) web pages by extra “meta-data” (data about data) to tell web browser (machine, person) the “real meaning” of page • The success of Google Search is “Big Data” approach; one mines the text on page to find “real meaning” • Obviously combination is powerful but the pure “Big Data” method is more powerful than expected 15 years ago
More data usually beats better algorithms Here's how the competition works. Netflix has provided a large data set that tells you how nearly half a million people have rated about 18,000 movies. Based on these ratings, you are asked to predict the ratings of these users for movies in the set that they have not rated. The first team to beat the accuracy of Netflix's proprietary algorithm by a certain margin wins a prize of $1 million! Different student teams in my class adopted different approaches to the problem, using both published algorithms and novel ideas. Of these, the results from two of the teams illustrate a broader point. Team A came up with a very sophisticated algorithm using the Netflix data. Team B used a very simple algorithm, but they added in additional data beyond the Netflix set: information about movie genres from the Internet Movie Database(IMDB). Guess which team did better? AnandRajaraman is Senior Vice President at Walmart Global eCommerce, where he heads up the newly created @WalmartLabs, http://anand.typepad.com/datawocky/2008/03/more-data-usual.html 20120117berkeley1.pdf Jeff Hammerbacher
Bina Ramamurthy http://www.cse.buffalo.edu/~bina/cse487/fall2011/
Types of Data Deluge • Traditional business transaction data from credit cards to stock market • Interaction data as in LinkedIn and Facebook • Information retrieval with topic and language etc. enhancements • Recommender and user customization systems • Marketing information as produced in operation of Walmart • Pervasive sensors in vehicles and people (health) • Scientific Instruments such as satellites, telescopes, Large Hadron Colliders, Gene Sequencers • Military sensors and satellites
AnjulBhambhri, VP of Big Data, IBM http://fisheritcenter.haas.berkeley.edu/Big_Data/index.html
Tom Davenport Harvard Business School http://fisheritcenter.haas.berkeley.edu/Big_Data/index.html Nov 2012
Jeff Hammerbacher’s Process • Identify problem • Instrument data sources • Collect data • Prepare data (integrate, transform, clean, impute, filter, aggregate) • Build model • Evaluate model • Communicate results 20120117berkeley1.pdf Jeff Hammerbacher
Another Jeff HammerbacherProcess • Obtain • Scrub • Explore • Model • Interpret 20120117berkeley1.pdf Jeff Hammerbacher
Statistician Colin Mallows • Identify data to collect and its relevance to your problem • Statistical specification of the problem • Method selection • Analysis of method • Interpret results for non-statisticians 20120117berkeley1.pdf Jeff Hammerbacher
Ben Fry Data Visualizationhttp://en.wikipedia.org/wiki/Benjamin_Fry • Acquire • Parse • Filter • Mine • Represent • Refine • Interact 20120117berkeley1.pdf Jeff Hammerbacher
Peter Huber Statistics (UCB) • Inspection • Error checking • Modification • Comparison • Modeling and model fitting • Simulation • What-if analyses • Interpretation • Presentation of conclusions 20120117berkeley1.pdf Jeff Hammerbacher
Jim Gray Microsoft Database/eScience • Capture • Curate • Communicate Ted Johnson • Assemble an accurate and relevant data set • Choose the appropriate algorithm 20120117berkeley1.pdf Jeff Hammerbacher
Tom Davenport Harvard Business School http://fisheritcenter.haas.berkeley.edu/Big_Data/index.html Nov 2012
General Remarks I • An immature (exciting) field: No agreement as to what is data analytics and what tools/computers needed • Databases or NOSQL? • Shared repositories or bring computing to data • What is repository architecture? • Sources: Data from observation or simulation • Different terms: Data analysis, Datamining, Data analytics., machine learning, Information visualization • Fields: Computer Science, Informatics, Library and Information Science, Statistics, Application Fields including Business • Approaches: Big data (cell phone interactions) v. Little data (Ethnography, surveys, interviews) • Topics: Security, Provenance, Metadata, Data Management, Curation
General Remarks II • Tools: Regression analysis; biostatistics; neural nets; bayesian nets; support vector machines; classification; clustering; dimension reduction; artificial intelligence; semantic web • One driving force: Patient records growing fast • Another: Abstract graphs from net leads to community detection • Some data in metric spaces; others very high dimension or none • Large Hadron Collider analysis mainly histogramming – all can be done with MapReduce (larger use than MPI) • Commercial: Google, Bing largest data analytics in world • Time Series: Earthquakes, Tweets, Stock Market (Pattern Informatics) • Image Processing from climate simulations to NASA to DoD to Radiology (Radar and Pathology Informatics – same library) • Financial decision support; marketing; fraud detection; automatic preference detection (map users to books, films)
Algorithms for Data Analytics • In simulation area, it is observed that equal contributions to improved performance come from increased computer power and better algorithmshttp://cra.org/ccc/docs/nitrdsymposium/pdfs/keyes.pdf • In data intensive area, we haven’t seen this effect so clearly • Information retrieval revolutionized but • Still using Blast in Bioinformatics (although Smith Waterman etc. better) • Still using R library which has many non optimal algorithms • Parallelism and use of GPU’s often ignored