Download
1 / 75
780 likes | 870 Views
Learn the fundamentals of EKG, including electrophysiology, lead placement, normal EKG patterns, and cardiac action potential phases. Explore EKG paper and intervals, as well as the history of EKG evolution.

E N D
EKG 101 - Introduction Scott E. Ewing DO Lecture #1
Introduction • Electrophysiology • Anatomy • Depolarization • EKG Paper • Lead Placement • Normal EKG • Waves / Intervals / Segments
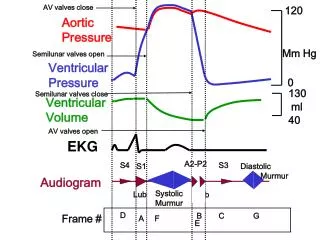
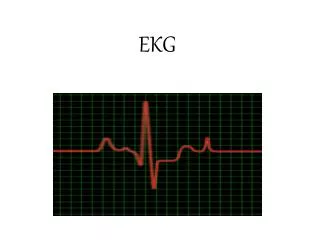
Cardiac Action Potential • SA node, AV node, Purkinje cells display pacemaker activity (phase 4 depolarization) • Body surface manifestation of the depolarization and repolarization waves • P wave – atrial depolarization • QRS – ventricular muscle depolarization • T wave – ventricular repolarization • PR interval – conduction time from atrium to ventricle • QRS duration – time required for all of the ventricular cells to be activated (i.e. the intraventricular conduction time) • QT interval – duration of the ventricular action potential
Cardiac Action Potential • Phase 0: Rapid depolarization • Sodium moves rapidly into the cell • Calcium moves slowly into the cell • Phase 1: Early repolarization • Sodium channels close • Phase 2: Plateau • Calcium continues to flow in • Potassium continues to flow out • Phase 3: Rapid repolarization • Calcium channels close • Potassium flows out rapidly • Active transport Na+ / K+ pump • Phase 4: Resting • Cell membrane is impermeable to sodium • Potassium moves out
EKG Paper • Time intervals indicated for the thick and thin vertical grid lines • Amplitudes indicated for the thick and thin horizontal grid lines • Each small square 0.04 s × 0.1 mV and each large square 0.20 s × 0.5 mV
Willem Einthoven (1860 – 1927) • Dutch doctor and physiologist • Invented the first practical electrocardiogram in 1903 • Nobel Prize Medicine in 1924 • Died in Leiden in the Netherlands and is buried in the graveyard of the Reformed Church at 6 Haarlemmerstraatweg in Oegstgeest
Evolution of the Electrocardiogram • Upper record was made using the capillary electrometer • Middle record is a "corrected curve“ • Lower record was made using Einthoven's string galvanometer
Normal Findings • Tall R waves • Prominent U waves • ST segment elevation (hightake off, benign early repolarization) • Exaggerated sinus arrhythmia • Sinus bradycardia • Wandering atrial pacemaker • Wenckebach phenomenon • Junctional rhythm • 1st degree heart block
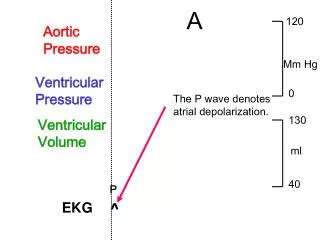
P Wave • Atrial activation begins in the SA node • Spreads in radial fashion to depolarize the right atrium, interatrial septum, then the left atrium • Last area of the left atrium to be activated is the tip of the left atrial appendage • Normal amplitude • Seldom exceeds 0.25 mV (2.5 small squares) normally in limb leads • In precordial leads, positive component is normally less than 0.15 mV
P Wave Characteristics • Positive in leads I and II • Best seen in leads II and V1 • Commonly biphasic in lead V1 • < 120 ms (3 small squares) in duration • < 100 ms (2.5 small squares) in amplitude
PR Interval • Beginning P wave to beginning QRS complex • Interval between onset atrial depolarization and onset ventricular depolarization • Time required for the activation impulse to advance from atria through the AV node, bundle of His, bundle branches, Purkinje fibers until ventricular myocardium begins to depolarize • Normal PR Interval • 120 – 200 ms (adults) • Should be taken from lead with the largest and widest P wave and longest QRS duration
PR Segment • Horizontal line between the end of the P wave and the beginning of the QRS complex • Duration depends on the duration of the P wave as well as the impulse conduction through the AV junction • Usually isoelectric, however it is often displaced in a direction opposite to the polarity of the P wave • Depressed in most of the conventional leads except aVR • Displacement is mainly due to atrial repolarization
QRS Complex • Q wave – Any initial negative deflection • R wave – Any positive deflection • S wave – Any negative deflection after an R wave
QRS Complex • Resultant electrical forces generated from ventricular depolarization • Begins at middle third of left interventricular septal surface • Spreads in a rightward direction • RV begins to depolarize shortly after initiation of LV activation • Basal portion of septum and posterobasal portion of LV free wall are last areas of depolarization • LV contributes most of the QRS forces due to larger muscle mass
QRS Complex • QRS duration represents duration of ventricular activation • Should be measured from lead with widest QRS complex • Traditionally measured from the limb leads, but V1 or V2 may have the widest complex • Normal QRS varies between 60 – 110 ms
QRS Complex • Lead I: usually records a dominant R wave • Lead II: invariably has prominent R wave since mean vector is always toward II if QRS axis is normal • Lead aVR: always records negative deflection • Lead III: variable
ST Segment • Segment between end of QRS complex (J point) and beginning of T wave • Represents state of unchanged polarization between end of depolarization and beginning of repolarization • Stage when terminal depolarization and starting repolarization are superimposed and cancel each other
ST Segment • Most important information regarding ST segment is presence or absence and degree of displacement from isoelectric line • TP segment is used as reference baseline • Limb leads – elevation or depression < 1mm • Precordial leads – elevation sometimes seen and normal in V2-V3 (< 2mm), rarely > 1mm in V5-V6 • Any ST depression in precordial leads is abnormal (normal vector in horizontal plane is anterior and leftward)
T Wave • Represents potential for ventricular repolarization • Proceeds in general direction of ventricular excitation • Polarity of resultant T wave is similar to that of the QRS vector • Upright in I, II, V5-V6 • Inverted in aVR • When inverted in 2 or more of right precordial leads, referred to as persistent juvenile pattern