Download
1 / 60
600 likes | 913 Views
GEOGG142 GMES Calibration & validation of EO products. Dr. Mat Disney mdisney@geog.ucl.ac.uk Pearson Building room 113 020 7679 0592 www.geog.ucl.ac.uk/~mdisney. Outline. Calibration Example: AVHRR NDVI across time Multiple AVHRR (and different) sensors: calibration, drift etc.

E N D
GEOGG142 GMESCalibration & validation of EO products Dr. Mat Disney mdisney@geog.ucl.ac.uk Pearson Building room 113 020 7679 0592 www.geog.ucl.ac.uk/~mdisney
Outline • Calibration • Example: AVHRR NDVI across time • Multiple AVHRR (and different) sensors: calibration, drift etc. • Validation • Example: MODIS NPP product • Time, space, measurements? • Scaling?
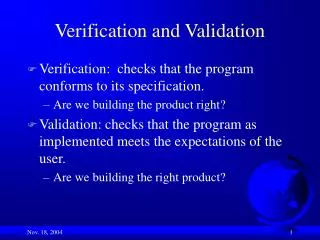
Calibration & validation? • Calibration: • process of converting an instrument reading to a physically meaningful measurement • Particularly radiometric calibration • i.e. from DN to radiance measurement • Validation: • experiments designed to verify instrument measurements using independent measurements • Both essential to scientific remote sensing Material from J. Morley
Example: calibration of AVHRR NDVI • Calibration: • We observe a known target, and relate output DNs to target radiance • Known targets: • prelaunch, lab targets (e.g. AVHRR) • on-board lamps (e.g. CZCS) • astronomical objects (Sun, Moon, space E.g., SeaWIFS) • ‘invariant’ surfaces (e.g. deserts) Material from J. Morley
Example: calibration of AVHRR NDVI • Normalised Difference Vegetation Index (NDVI): • Simple to compute value, based on radiances in red and near infrared spectral regions • NDVI = (L_NIR – L_R) / (L_NIR + L_R) • Value range = -1 to +1 • EMPIRICALLY related to vegetation amount due to spectral response of plant leaves (‘red edge’) Material from J. Morley
Example: MODIS EVI GLobal EVI winter/spring 2001 http://svs.gsfc.nasa.gov/vis/a000000/a002300/a002317/index.html
Issues in NDVI calibration • The biggest issue is the atmosphere • Particularly: • – Rayleigh scattering • – ozone • – water vapour • – aerosols • See van Leeuwen et al., 2006 • Different versions of NDVI product (c4 NOT comparable w c5) • Saleska et al. (2005) Amazon Forests Green-Up During 2005 Drought, Science • Samanta et al. (2010) Amazon forests did not green‐up during the 2005 drought, GRL • ??? Material from J. Morley
Rayleigh scattering • Scattering of light by gas molecules in atmos. • Biased towards the short visible wavelength & adds radiance to the red channel • Quite easily calculated based on surface altitude (hence surface pressure) • Reference values for Rayleigh optical depths for standard pressure and temperature conditions are available • Vegetated areas have low red reflectance, so Rayleigh scat. can substantially decrease NDVI Material from J. Morley
Ozone and water vapour absorption • Optical bands weakly affected by ozone absorption. • Water vapour absorption bands near 0.9 μm and 1.1 μm -> NIR is considerably affected. • Water vapour reduces the observed NIR & hence NDVI • The longer path length from the sun - to the surface - to the satellite, greater effect of water vapour has • Off-nadir views more affected • Difference in products when corrections introduced Material from J. Morley
Aerosols • Effects vary depending on particle size e.g. difference between volcanic and forest fire aerosols • Note particularly El Chichon and Mount Pinatubo eruptions left aerosol in atmos. for ~2 years each • Need better spectral resolution for correction, e.g. MODIS, or modelling Material from J. Morley
AVHRR? Material from J. Morley
Aerosols Material from J. Morley
Empirical mode decomposition (EMD) http://glcf.umiacs.umd.edu/data/gimms/description.shtml Material from J. Morley
Sensor intercomparison? Material from J. Morley
Validation example: MODIS NPP • Productivity recap: Net Primary Productivity (NPP) • annual net carbon exchange • quantifies actual plant growth • Conversion to biomass (woody, foliar, root) • i.e. not just C02 fixation (GPP) • NPP = GPP – Ra (plant respiration) • MODIS product example used here • MOD17 GPP/NPP ATBD • ntsg.umt.edu/MOD17 • http://neo.sci.gsfc.nasa.gov/Search.html • Turner et al (2005)
Productivity recap • GPP/NPP from MODIS • Requirements? • MOD17 ATBD • Running et al. (2004) • Turner et al. (2005) • Zhao et al. (2005) • Heinsch et a. (2006)
MODIS GPP/NPP + QC?? http://secure.ntsg.umt.edu/projects/index.php/ID/ca2901a0/fuseaction/projects.detail.htm
MOD17 validation approach • Need to address time (days to years) and space (local to global) • Permanent network of ground validation sites • Quantify seasonal and interannual dynamics of ecosystem activity (cover time domain) • EO to quantify heterogeneity of biosphere • Quantify land cover, land cover change dynamics • Models to: • Quantify, understand unmeasured ecosystem • Provide predictive capability (in time AND space)
How on earth…..???? • …can we “validate” an EO-derived estimate of something that depends on soil, climate, land cover etc.? • Given that it requires various models to go from a satellite observation (radiance), to reflectance, to LAI/FAPAR, to PSN, to GPP to NPP • At 500m-1km pixels. Globally. • And how do you even “measure” NPP on the ground??
So, how might we validate? • Need to consider scale • Relate measurements at the small scale to 1km pixels?? • Flux tower approach • Eg BIGFOOT approach, FLUXNET etc. • Measurements and validation at many scales • Models to bridge time/space scales • (but how good are models…?) Fig from MOD17 ATBD
Ecosystem measurements: FLUXNET Fig from MOD17 ATBD http://daac.ornl.gov/FLUXNET/
Ecosystem measurements: FLUXNET 1999 http://daac.ornl.gov/FLUXNET/ http://earthobservatory.nasa.gov/Features/Fluxnet/
Ecosystem measurements: FLUXNET 2009 http://daac.ornl.gov/FLUXNET/ http://www.fluxnet.ornl.gov/fluxnet/graphics.cfm http://earthobservatory.nasa.gov/Features/Fluxnet/
Ecosystem measurements: FLUXNET http://daac.ornl.gov/FLUXNET/
Ecosystem measurements: FLUXNET by biome Some distribution of biome types, but clearly biased in location Even considering only limited biomes http://daac.ornl.gov/FLUXNET/
BigFoot approach to validating MODIS NPP • E.g. Turner et al. (2005), 6 sites spanning range of vegetation and climate • Crops, forest, tundra, grassland • 5 x 5 km site at each plot (25 MODIS pixels) • Flux tower & 100 (25x25m) sample plots within each area, seasonally measured for LAI and above-ground (A)NPP (from harvested leaf and wood material) • Land cover from high res EO • Use measured data at sample plots to calculate NPP, GPP • Spatially distribute across site using (vegetation-calibrated) BiomeBGC model • Requires daily met data, land cover, LAI • Gives measured estimate from ground AND flux tower
BigFoot v flux tower GPP Turner et al. (2005)
BigFoot v MODIS GPP Not such good agreement as for flux tower (not surprisingly) Turner et al. (2005)
Comparison of MODIS NPP with flux data Differences due to Ra (autotrophic i.e. plant respiration)? PAR, VPD differences between those from DAO and actual? (VPD = deficit between the amount of moisture in the air and how much moisture the air can hold when it is saturated) Turner et al. (2005)
DAO PAR, VPD? Clearly some sites better agreement than others PAR generally good (relatively easy to measure) VPD less so e.g. SEVI (desert grassland site) VPD Other issues? Turner et al. (2005)
MODIS-estimated v BigFoot FPAR How do you measure FPAR even on the ground?? Requires models to interpret measurements of radiation Turner et al. (2005)
MODIS-estimated v BigFoot LUE (light use efficiency) LUE inferred from flux data Again, hard to even measure this on the ground….. Turner et al. (2005)
Zhao et al. (2005) Heinsch et al. (2006)
Process/SVAT (soil-veg-atm-transport) models Fig from MOD17 ATBD
Process models: how do we test/validate? From Running et al. (2004) MOD17 ATBD Biome-BGC model predicts the states and fluxes of water, carbon, and nitrogen in the system including vegetation, litter, soil, and the near-surface atmosphere i.e. daily PSN
Process models: how do we test/validate? http://www.ntsg.umt.edu/models/bgc/ Fig from MOD17 ATBD
Data-Model Fusion [Using multiple streams of datasets with parameter optimization] C stock and flux measurements Inventory analyses Process-based information Climate data Remote sensing information CO2 column from space Inverse modeling Process-based modeling Retrospective and forward analyses Canadell et al. 2000
Multi-level model/data validation • MOD17 ATBD: Synergy of various carbon measurement programs Fig from MOD17 ATBD