Download
1 / 23
230 likes | 363 Views
A Static Binary Instrumentation Threading Model for Fast Memory Trace Collection. Michael Laurenzano 1 , Joshua Peraza 1 , Laura Carrington 1 , Ananta Tiwari 1 , William A. Ward 2 , Roy Campbell 2 1 Performance Modeling and Characterization ( PMaC ) Laboratory, San Diego Supercomputer Center

E N D
A Static Binary Instrumentation Threading Model for Fast Memory Trace Collection Michael Laurenzano1, Joshua Peraza1, Laura Carrington1, Ananta Tiwari1, William A. Ward2, Roy Campbell2 1Performance Modeling and Characterization (PMaC) Laboratory, San Diego Supercomputer Center 2High Performance Computing Modernization Program (HPCMP), United States Department of Defense
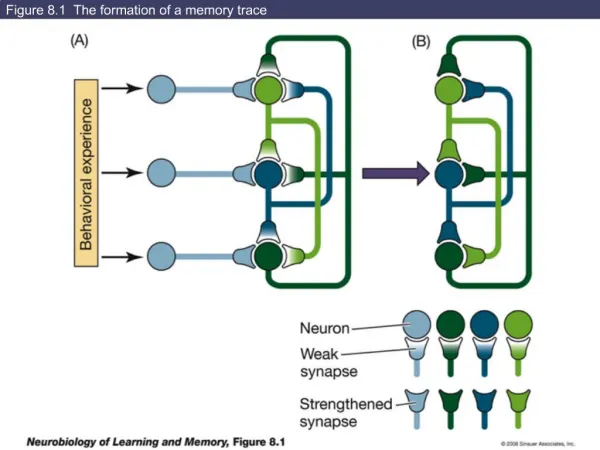
Memory-driven HPC • Many HPC applications are memory bound • Understanding application requires understanding memory behavior • Measurement? (e.g. timers or hardware counters) • Measuring at fine grain with reasonable overheads & transparently is HARD • How to get sufficient detail (e.g., reuse distance?) • Binary instrumentation • Obtains low-level details of address stream • Details are attached to specific structures within the application
HPC Target System PMaC Performance/Energy Models Performance Model – a calculable expression of the runtime, efficiency, memory use, etc. of an HPC program on some machine HPC Target System HPC Application HPC Application Application signature – detailed summaries of the fundamental operations to be carried out by the application Machine Profile – characterizations of the rates at which a machine can carry out fundamental operations Requirements of HPC Application – Application Signature Characteristics of HPC system – Machine Profile Measured or projected via simple benchmarks on 1-2 nodes of the system Collected via trace tools Performance of Application on Target system Convolution Methods map Application Signatures to Machine Profiles produce performance prediction
Runtime Overhead is a Big Deal • Real HPC applications • Relatively long runtimes: minutes, hours, days? • Lots of CPUS: O(107) in largest supercomputers • High slowdowns create problems • Too long for queue • Unsympathetic administrators/managers • Inconvenience • Unnecessarily use resources • PEBIL = PMaC’sEfficient Binary Instrumentation for x86/Linux
What’s New in PEBIL? • It can instrument multithreaded code • Developers use OpenMP and pthreads! • x86_64 only • Provide access to thread-local instrumentation data at runtime • Supports turning instrumentation on/off • Very lightweight operation • Swap nops with inserted instrumentation code at runtime • Overhead close to zero when all instrumentation is removed
Binary Instrumentation in HPC • Tuning and Analysis Utilities (TAU) – Dyninst and PEBIL • HPCToolkit – Dyninst • Open SpeedShop – Dyninst • Intel Parallel Studio – Pin • Memcheck memory bug detector – Valgrind valgrind –-leak-check=yes ... • Understanding performance and energy • Many research projects (not just HPC) • BI used in 3000+ papers in the last 15 years
Binary Instrumentation BasicsMemory Address Tracing Original Instrumented 0000c000 <foo>: c000: 48 89 7d f8 mov %rdi,-0x8(%rbp) c004: 5e pop %rsi c005: 75 f8 jne 0xc004 c007: c9 leaveq c008: c3 retq 0000c000 <foo>: c000: // compute -0x8(%rbp) and copy it to a buffer c008: 48 89 7d f8 mov %rdi,-0x8(%rbp) c00c: // compute (%rsp) and copy it to a buffer c014: 5e pop %rsi c015: 75 f8 jne 0xc00c c017: c9 leaveq c018: c3 retq
Enter Multithreaded Apps 0000c000 <foo>: c000: // compute -0x8(%rbp) and copy it to a buffer c008: 48 89 7d f8 mov %rdi,-0x8(%rbp) c00c: // compute (%rsp) and copy it to a buffer c014: 5e pop %rsi c015: 75 f8 jne 0xc00c c017: c9 leaveq c018: c3 retq • All threads use a single buffer? • Don’t need to know which thread is executing • A buffer for each thread? • Faster. No concurrency operations needed • More interesting. Per-thread behavior != average thread behavior • PEBIL uses the latter • Fast method for computing location of thread-local data • Cache that location in a register if possible
Thread-local Instrumentation Data in PEBIL • Provide a large table to each process (2M) • Each entry is a small pool of memory (32 bytes) • Must be VERY fast • Get thread id (1 instruction) • Simple hash of thread id (2 instructions) • Index table with hashed id (1 instruction) • Assume no collisions (so far so good) Hash Function Thread-local memory pools thread 1 id thread 2 id thread 3 id thread 4’s memory pool thread 4 id
Caching Thread-local Data • Cache the address of thread-local data • Dead registers are known at instrumentation time • Is there 1 register in a function which is dead everywhere? • Compute thread-local data address only at function [re]entry • Should use smaller scopes! (loops, blocks) Significant reductions
Other x86/Linux Binary Instrumentation 1Pin: Building Customized Program Analysis Tools with Dynamic Instrumentation. Luk, C., Cohn, R., Muth, R., Patil, H., Klauser, A., Lowney, G., Wallace, S., Vijay JanapaReddi, and Hazelwood, K. ACM SIGPLAN Conference on Programming Language Design and Implementation, 2005. 2An API for Runtime Code Patching. Buck, B. and Hollingsworth, J. International Journal of High Performance Computing Applications, 2000. 3PEBIL: Efficient Static Binary Instrumentation for Linux. Laurenzano, M., Tikir, M., Carrington, L. and Snavely, A. International Symposium on the Performance Analysis of Systems and Software, 2010.
Runtime Overhead Experiments • Basic block counting • Classic test in binary instrumentation literature • Increment a counter each time a basic block is executed • Per-block, per-process, per-thread counters • Memory address tracing • Fill a process/thread-local buffer with memory addresses, then discard those addresses • Interval-based sampling • Take the first 10% of each billion memory accesses • Toggle instrumentation on/off when moving between sampling/non-sampling
Methodology • 2 quad-core Xeon X3450, 2.67GHz • 32K L1 and 256K L2 cache per core, 8M L3 per processor • NAS Parallel Benchmarks • 2 sets: OpenMP and MPI, gcc/GOMP and gcc/mpich • 8 threads/processes: CG, DC (omp only), EP, FT, IS, LU, MG • 4 threads/processes: BT, SP • Dyninst 7.0 (dynamic) • Timing started when instrumented app begins running • Pin 2.12 • PEBIL 2.0
Basic Block Counting (MPI) • All results are average of 3 runs • Slowdown relative to un-instrumented run • 1 == no slowdown
Basic Block Counting (OpenMP) • Y-axis = log-scale slowdown factor • Dyninst thread ID lookup at every basic block
Memory Tracing (MPI) • Slowdown relative to un-instrumented application
Memory Tracing (OpenMP) • Instrumentation code inserted at every memory instruction • Dyninst computes thread ID at every memop • Pin runtime-optimizes instrumented code • Lots of opportunity to optimize 30s 7h45m
Interval-based Sampling • Extract useful information from a subset of the memory address stream • Simple approach: the first 10% of every billion addresses • In practice we use a window 100x as small • Obvious: avoid processing addresses (e.g., just collect and throw away) • Not so obvious: avoid collecting addresses • Instrumentation tools can disable/re-enable instrumentation • PEBIL: binary on/off. Very lightweight, but limited • Pin and Dyninst: arbitrary removal/reinstrumentation. Heavyweight, but versatile • Sampling only requires on/off functionality
Sampled Memory Tracing (MPI) • PEBIL always improves, and significantly • Pin usually, but not always improves • Amount and complexity of code re-instrumented during each interval probably drives this • Dyninst never improves • P
Conclusions • New PEBIL features • instrument multithreaded binaries • Turn instrumentation on/off • Fast access to per-thread memory pool to support per-thread data collection • Reasonable overheads • Cache memory pool location • Currently done at function level • Future work: smaller scopes • PEBIL is useful for practical memory address stream collection • Message passing or threaded
Questions? https://github.com/mlaurenzano/PEBIL michaell@sdsc.edu