Download
1 / 6
60 likes | 211 Views
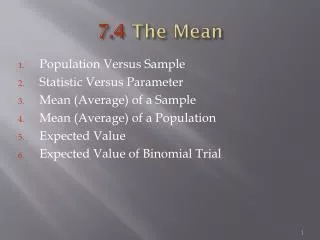
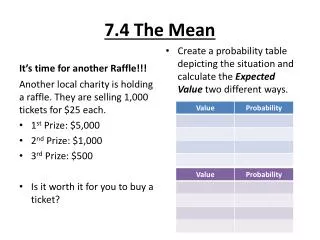
7.4 The Mean. The Mean. The Sample Mean. The sample mean is the mean (or average) of what actually occurs This is calculated as: n is the number of items observed. x number is each individual occurance. The mean of a situation can be theoretical or experimental.

E N D
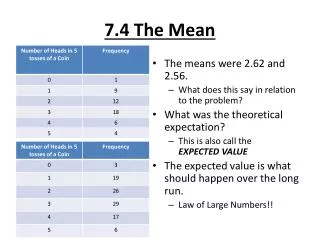
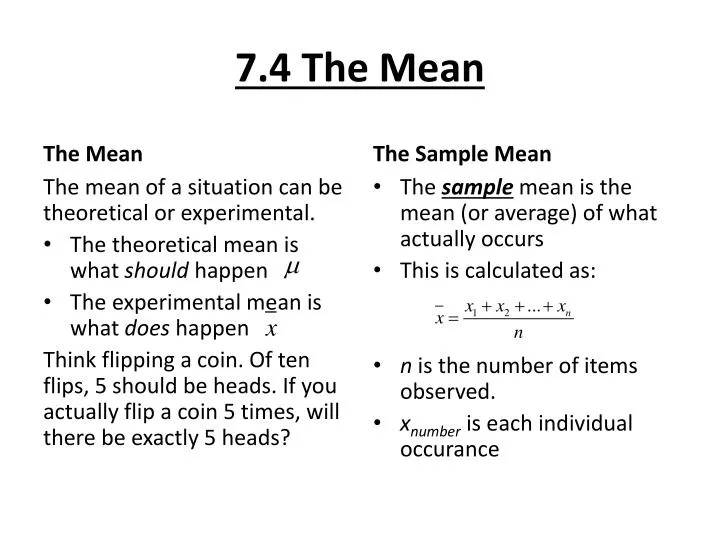
7.4 The Mean The Mean The Sample Mean The sample mean is the mean (or average) of what actually occurs This is calculated as: n is the number of items observed. xnumber is each individual occurance The mean of a situation can be theoretical or experimental. • The theoretical mean is what should happen • The experimental mean is what does happen Think flipping a coin. Of ten flips, 5 should be heads. If you actually flip a coin 5 times, will there be exactly 5 heads?
7.4 The Mean Mean of Frequency Tables Find the sample mean:
7.4 The Mean Mean of Frequency Tables Can we do this any differently?
7.4 The Mean Mean of Frequency Tables Would we calculate this the same?
7.4 The Mean What is the easiest way to calculate the sample mean? This is the mathematical explanation of why… This basically just says you multiply the x value by it’s relative frequency. This will work for any frequency chart. • Change it to relative frequency • Multiply the relative frequency by its x value • Add those values together to achieve the mean
7.4 The Mean Homework to complete: • Find the mean of each: