Download
1 / 21
210 likes | 382 Views
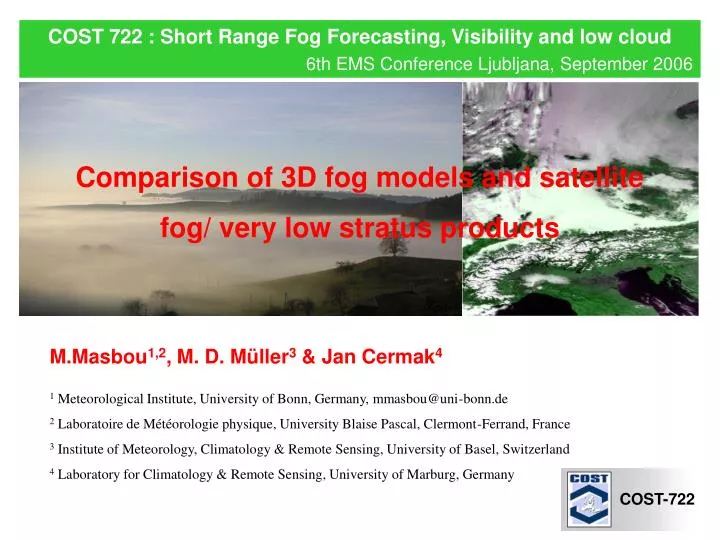
COST-722. COST 722 : Short Range Fog Forecasting, Visibility and low cloud. 6th EMS Conference Ljubljana, September 2006. Comparison of 3D fog models and satellite fog/ very low stratus products. M.Masbou 1,2 , M. D. Müller 3 & Jan Cermak 4.

E N D
COST-722 COST 722 : Short Range Fog Forecasting, Visibility and low cloud 6th EMS Conference Ljubljana, September 2006 Comparison of 3D fog models and satellite fog/ very low stratus products M.Masbou1,2, M. D. Müller3 & Jan Cermak4 1 Meteorological Institute, University of Bonn, Germany, mmasbou@uni-bonn.de 2 Laboratoire de Météorologie physique, University Blaise Pascal, Clermont-Ferrand, France 3 Institute of Meteorology, Climatology & Remote Sensing, University of Basel, Switzerland 4 Laboratory for Climatology & Remote Sensing, University of Marburg, Germany
Three-dimensional Fog forecast model Simulation on the same Lindenberg Area (Germany N 53,21 W 14,11) NMM-PAFOG Based on NMM non-hydrostatic Model (Janjic Z. I., 2003) Hz. Resolution:1 x 1 kmArea:160 x 160 km Vert. Resolution:45 Levels concentrated nearest the ground Initialization and Boundary:NMM 13 km LM-PAFOG Based on “Lokal Modell” (LM) non-hydrostatic Model (Steppeler J. & al., 2003) Hz. Resolution:2.8 x 2.8 kmArea:280 x 280 km Vert. Resolution:40 Levels Δzmin=4m at the ground Initialization and Boundary:LME Model 7km available for all Europe Same Fog Microphysics Parameterization PAFOG (Bott & Trautmann 2002)
MSG SEVIRI Satellite Products 1- Fog is a cloud 2- in water phase 3- composed of small droplets 4- low above the ground and 5- stratiform Satellite Products
Threshold Cloud Confidence Range Confidence Level is set to 5 K If 0.5 1.0 0.0 Pc- Cloud Confidence Level Blackbody temperature difference Cloudy Clear
Comparison 3D Models – Satellite Products : How to procede ? Interpolation of satellite data to high resolution model grid Compute contingency table based on pixel values. Confidence value threshold of 45 % for fog discrimination
September, 27th 2005 + + 01 UTC NOAA17
LM-PAFOG Δx=2.8km 280x280 km NMM-PAFOG Δx= 1 km 160x160 km Lindenberg Area – September 2005, 27th 00UTC
LM-PAFOG Δx= 2.8km 280x280 km NMM-PAFOG Δx= 1 km 160x160 km Lindenberg Area – September 2005, 27th 01UTC
LM-PAFOG Δx= 2.8km 280x280 km NMM-PAFOG Δx= 1 km 160x160 km Lindenberg Area – September 2005, 27th 02UTC
LM-PAFOG Δx= 2.8km 280x280 km NMM-PAFOG Δx= 1 km 160x160 km Lindenberg Area – September 2005, 27th 03UTC
LM-PAFOG Δx= 2.8km 280x280 km NMM-PAFOG Δx= 1 km 160x160 km Lindenberg Area – September 2005, 27th 04UTC
LM-PAFOG Δx= 2.8km 280x280 km NMM-PAFOG Δx= 1 km 160x160 km Lindenberg Area – September 2005, 27th 05UTC
LM-PAFOG Δx= 2.8km 280x280 km NMM-PAFOG Δx= 1 km 160x160 km Lindenberg Area – September 2005, 27th 06UTC
LM-PAFOG: Forecast hour 10 UTC – DECEMBER 2005 LWC 2m Integrated LWC 0-2000m
NMM-PAFOG: Forecast hour 38 UTC – DECEMBER 2005 LWC 2m Integrated LWC 0-2000m
INTEGRATED LWC 0-2 000m: Larger Statistic LM-PAFOG NMM-PAFOG LM-PAFOG Accordance between Satellite Products and 3D Models BUT, Both Model have RELATIVELY LOW discrimination capabilities Further Developments are necesserary
870m Lindenberg Verification with NOAA data - 10 October 2005 NMM_PAFOG Test on Zurich Area NOAA/AVHRR
Verification with Meteosat 8 data - 11 October 2005 Zürich airport Zürich airport
Verification with Meteosat 8 data - 11 October 2005 Zürich airport Zürich airport 90 km
CONCLUSION - Modelled 2m LWCnot directly comparable to currently available satellite products (Low stratus Products) - Integrated Column water 0-2000m COMPARABLE - Zurich results from COMPLEX TOPOGRAPHY show BETTER performance. - Comparison Satellite fog mask/3D fog Models Outlook - Long time verification on Zurich Area COST 722 Thanks