Download
1 / 30
340 likes | 582 Views
The EU Emissions Trading Scheme (ETS). Environmental Policy: Taxes, Permits, Standards. 1. Emissions Trading Scheme. … designed as an entity-based (countries) domestic cap & trade emissions allowance programme … governed by Community Law specifying specific

E N D
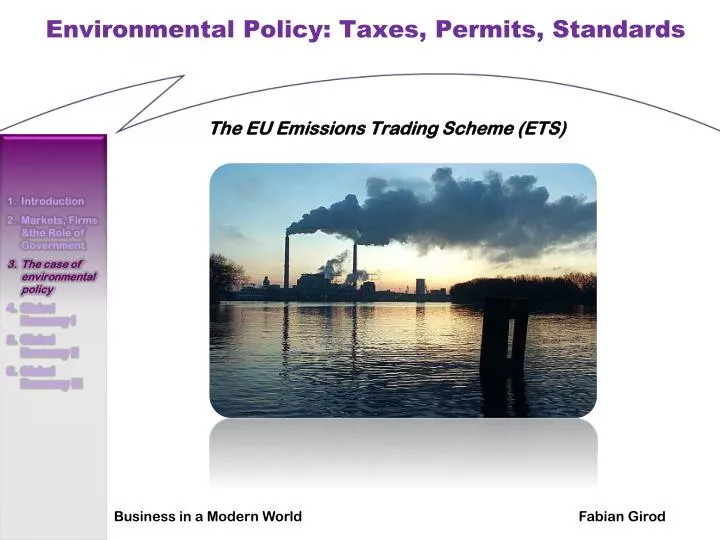
The EU Emissions Trading Scheme (ETS) Environmental Policy: Taxes, Permits, Standards
1. EmissionsTradingScheme … designed as an entity-based (countries) domestic cap & trade emissionsallowanceprogramme … governed by Community Law specifying specific conditions for trading between entities & using a special unit of trade – allowances – within the EU … compatible with international emissions trading under the Kyoto Protocol (negotiated 1997; became effective 2005) & contribute towards achievement of KP target entity-based domestic cap & trade allowance scheme ...follow up agreement is going to discussed in Durban, 28th Nov. To 9th Dec. 2011
1. EmissionsTradingScheme Coverage • start with carbon dioxide, other greenhouse gases are excluded at the moment • The ETS now operates in 30 countries (the 27 EU Member States plus Iceland, Liechtenstein and Norway) • CO2 emissions from installations such as power stations, combustion plants, oil refineries, iron & steel works, as well as factories making cement, glass, lime, bricks, ceramics, pulp, paper etc.
1. Emissions Trading Scheme Coverage (2) • Installations are registered, not companies • large installations • Approx. 12000 installations • These account for more than 45% CO2, 30% greenhouse gases in the EU • Other sectors like transport are not covered, but addresses but other governmental programs to reduce emissions
1. Emissions Trading Scheme Time scheduleofthe ETS & initial allocation of permits • Phase I: 2005 – 2007 • free allocation (grandfathering) • Phase II: 2008 – 2012 (incl. 2012) • Auctions for up to 10% of the permits • Phase III: post 2012 • A highershareofpermitsisplannedtobesold
1. EmissionsTradingScheme Allocation • Member States may auction up to 5% for 2005 to 2007 and up to 10% for 2008 to 2012 • Each Member State draws up an ex-ante national allocation plan (NAP); transparency and comments by the public. The third phase won’t allow NAPs anymore. • scrutinybytheCommission • Member States observecommonallocationcriteria
1. EmissionsTradingScheme Monitoringandreporting – companies will monitor & report emissions following certain monitoring & reporting guidelines – emission reports will be subject to independent verification registries – Member States & the Community must establish & maintain electronic registries to track allowances – at Community level a transaction log is maintained (see next slide)
1. Emissions Trading Scheme Sanctions – for every tonne of emissions that is not covered by an allowance a company will have to pay a penalty of 40€ in 2005 to 2007 & 100€ in the period 2008 – 2012 – companies will also have to surrender a compensating amount of allowances in the subsequent year
1. Emissions Trading Scheme Cost-effective realisation of Kyoto-targets: • cuts in greenhouse gases by 8% in the EU (average p.a. 2008-2012 compared to 1990) • e.g., UK: minus 12,5%; Germany: minus 21% European Emissions Trading Scheme (EU ETS): (see EU Directive 2003/87/EC) • CO2 emissions • energy-intensive sectors (iron and steel, minerals, energy, pulp and paper)
Cap from 2013 on • Cap for 2013 determined at 2,04 billion allowances • The cap for the year 2013 has been determined at 2,039,152,882 allowances, i.e. just under 2.04 billion allowances. • The cap will decrease each year by 1.74% of the average annual total quantity of allowances issued by the Member States
Emissions of carbon dioxide 2008 - (Mio t) Source: Eurostat
2. Data on the ETS Greenhouse gas emissions - Index of greenhouse gas emissions and targets - In CO2 equivalents (Actual base year = 100) Source: Eurostat
Allocationofemissions & verifiedemissions2006 2. Data on the ETS Source: Eurostat
Allocationofemissions, 2006 2. Data on the ETS Source: Eurostat
2. Data on the ETS Carbix – Price per certificateatthe EEX (European Energy Exchange) Source: EEX, Leipzig; 2008
2. Data on the ETS (2) Carbix – Price per certificateatthe EEX (European Energy Exchange) Source: EEX, Leipzig; Nov. 2011
Cost-/BenefitanalysisoftheGerman limestone industry2010 to 2020, fullauctionfrom 2013 on, CO2-Price 30 € (2010) 2. Data on the ETS
3. Problems and limitations Problems: (what should be!) Regulation of non-ETC sectors such that • marginal abatement costs are identical for all firms in the non-ETS sectors and ETS sectors (cost effectiveness) • national emission targets are met. • Info about marginal abatement costs necessary! Limited number of participating sectors ‘appropriate’? See discussion Airlines!
3. Problems and limitations Political-economic issues: • Limited number of ETS sectors makes lobbyism easier • generous allocation of allowances • stricter emission targets for non-ETS sectors • different marginal abatement costs (technological restrictions) • no overall cost-effectiveness
3. Problems and limitations Dynamic issues: • Allocation of allowances is decided for each period separately; no clear long-term perspective • incentives for strategic emission and production behaviour • lack of dynamic incentives due to uncertainty about future policy Existing National Allocation Plans: • Allocation plans at short notice, e.g.: the aviation industry might be included already within 3 years
3. Problems and limitations Distributional conflicts • Generous free-of-charge allocation of allowances: • preferential treatment of ETS sectors over non-ETS • unequal allocation within ETS sectors The question which arise with regard to the allocation is, what method to use when a distribution plan for certificates needs to be agreed on! Producing electricity is a different technological process and cannot be compared with the production of limestone.
3. Problems and limitations Competition Neutrality: Avoiding distortions of competition within the EU requires ‘identical’ cuts in emissions. Problem: Competition neutrality inconsistent with EU burden sharing Solution: • adjustment of total allowances for ETS sectors and respective emissions in non-ETS sectors BUT: inconsistent with cost-effectiveness • partial auctioning BUT: inconsistent with compensation objective
3. Problems and limitations Competition Neutrality (2) • Competition between EU and Rest-of-the-world • Compensation for abatement costs to avoid leakage effects Discussion: • Does international trade force states to implement lax environmental policies? (“Race to the bottom?”)
3. Problems and limitations NAP Allocations • The question of auctioning the permits and to which extend is still unsolved. • Allocations below ‘business-as-usual’ policy but to generous to contribute to Kyoto targets. • Preferential treatment of sectors exposed to international competition.
4. (some) Conclusions & remarks • Cost-effectiveness are only partially achieved. • The objective of neutrality with respect to competition is not compatible with the objective of compensation and cost-effectiveness, given the EU burden sharing. • Dynamic incentives are reduced by political uncertainty. • Administrative costs? • Conflicting goals: economic growth and environmental protection ?
References On various policies experiences: • Tietenberg, T. (2007), Environmental Economics and Policy, 5th Edition, Boston et al.: Pearson – Addison Wesley, chapter 14-15.
References On ETS: • European Commission on emission trading: http://ec.europa.eu/environment/climat/emission/index_en.htm • Gilbert, A., Bode, J.W., and Phylipsen, D. (2004), Analysis of the National Allocation Plans for the EU Emissions Trading Scheme. ECOFYS. • Grubb, M., Azar, C., and Persson, U.M. (2005), Allowance Allocation in the European Emissions Trading Scheme, Climate Policy 5 (2005), 127-136. • Kolshus, H.H., and Torvanger, A. (2005), Analysis of EU Member States’ National Allocation Plans, CICERO WP 2005:02. • Zetterberg, L., et al. (2004), Analysis of National Allocation Plans for the EU ETS, IVL Report, IVL Swedish Environmental Research Institute.