Download
1 / 25
• 250 likes • 382 Views
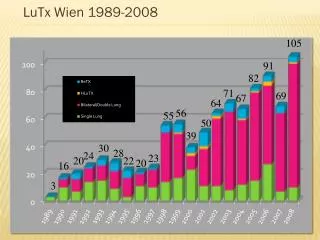
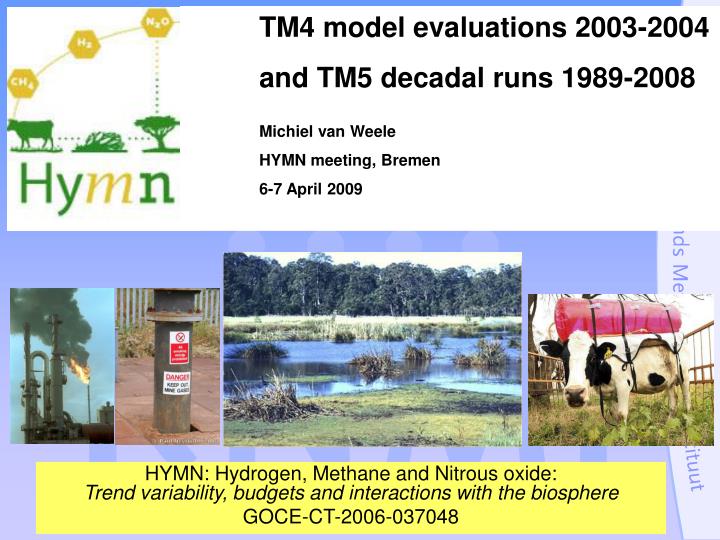
HYMN: Hydrogen, Methane and Nitrous oxide: Trend variability, budgets and interactions with the biosphere GOCE-CT-2006-037048. TM4 model evaluations 2003-2004 and TM5 decadal runs 1989-2008 Michiel van Weele HYMN meeting, Bremen 6-7 April 2009. HYMN modelling activities

E N D
HYMN: Hydrogen, Methane and Nitrous oxide:Trend variability, budgets and interactions with the biosphere GOCE-CT-2006-037048 TM4 model evaluations 2003-2004 and TM5 decadal runs 1989-2008 Michiel van Weele HYMN meeting, Bremen 6-7 April 2009
HYMN modelling activities I. Focus on the year 2004 (2003-2005) II. Decadal runs (1989-2008) Anthropogenic emissions bottom-up inventories CO, NOx etc A posteriori methane emission distributions from inverse modelling Net natural fluxes methane Global dynamical vegetation modelling (LPJ) Chemical-transport model simulations BQT: Bousquet a posteriori emissions and natural fluxes LPJ: Natural fluxes from LPJ replacing Bousquet natural fluxes Evaluations: Latitudinal distribution Seasonal cycle Station time series Comparisons against SCIAMACHY Comparisons against FTIR tropospheric and total column observations Evaluation ofemissions and concentration distributions using in-situ and satellite observations
Use of CTMs to better constrain the global methane budget? • Chemistry-transport modelling relates inventories and calculated emission distributions to surface concentration observations • E.g. The inter-hemispheric CH4 gradient allows about ~1/3 of CH4 • emissions between 30-90N and ~2/3 in the Tropics(+ Southern • Hemisphere) • CTM modelling is needed to interpret column VMR satellite • observations and to relate the satellite data to surface emissions • (regional distribution, seasonality)
Effect of a latitudinal shift in CH4 emissions on theInter Hemispheric Gradient solid line Tropics 58% NH 30% Dotted line Tropics 53% NH 35% Plus signs NOAA/GMD monthly means for Alert and South Pole • Shifting 5% (or 26 Tg CH4) from tropics to northern hemisphere: • Increases the Inter-Hemispheric Gradient (IHG) from 120 to 138 ppb • (after 1 year of simulation, new SH steady state not yet reached) • Observed IHG (2004): 129 ppb (using NOAA/GMD stations Alert and South Pole) • Effects on CH4 lifetime are negligible
Column VMR and Surface VMR Anthropogenic emissions + natural fluxes relate to surface concentration distributions Satellite CH4 observations relate to column-averaged concentration distributions All figures show August 2004
TM4; spatial resolution: (lon x lat) 3 x2 degrees; 34 layers in vertical; Years 2003-2004 CH4 budget CH4 Emissions (Bousquet a-posteriori) 534 Tg/a CH4 burden 4832 Tg Loss via tropospheric OH 498 Tg/a Loss in stratosphere 24 Tg/a CH4 soil sink 25 Tg/a CH4 trend -13 Tg/a CH4 lifetime 4832 / 547 8.8 yrs OH budget Relative contributions OH loss: OH + CO 40% OH + H2 5% OH + CH4 16% OH + HO2 5% OH + ROOH 15% OH + Isoprene 4% OH + O3 5% OH + H2O2 4% OH + HCHO 5% OH + Other 1% Relative contributions OH production: O3 + hv ~50% OH recycling (eg NOx) ~40% peroxides ~10% Feedbacks on CH4 lifetime dominated by changes in CO (Half of CO is produced from CH4 and NMHC oxidation) CH4 lifetime changes related to CO and NOx (modulated by VOCs) Methane lifetime
Anthropogenic CH4 emissions Bottom-up inventories Annual mean for 2004 (in Gg/cell/ month) Including rice paddies Excluding biomass burning
Bousquet a posteriori year 2004 Monthly mean surface methane concentrations near Sumatra
Natural methane flux spatial distribution (LPJ) August 2004 Sum of wetlands (inundated areas), wet soils, northern peatlands and soil consumption (flux < 0)
Natural methane flux spatial distribution (LPJ) Feb – Apr – Aug – Nov 2004
Seasonal variation in natural methane fluxes (LPJ) 30 – 90 N Tropical Black Total net flux Red Wet Soils Purple Northern Peatlands Blue WetlandsGreen Soil Sink
TM4 evaluation at 3 tropical sites: Assekrem(23N), Sumatra(Eq), Mt Kenya (Eq) Red: ObservationsBlue: BQT Green: LPJ Large signs: monthlymeans
18 8 1 7 14 2 11 19 10 9 15 5 4 23 13 22 3 6 12 21 20 16 17 TM4 model validation per region with SCIAMACHY
Indo Aus Americas Africa Eurasia Atlantic Polar Pacific-Indian Regional mean column mixing ratio’s (in ppbv) for year 2004 SCIA = SCIAMACHY observations TM4BQT = a posteriori emission distribution Philippe TM4LPJ = idem, but with LPJ CH4 fluxes replacing wetlands, rice, and soil sink Model validation per region with SCIAMACHY 1-4 5-6 7-11 12-13 14-16 17-18 19-23
Absolute differences in regional mean column mixing ratios (in ppbv) SCIA = SCIAMACHY observations TM4BQT = a posteriori emission distribution TM4LPJ = idem, but with LPJ CH4 emissions replacing wetlands+rice 1-4 5-6 7-11 12-13 14-16 17-18 19-23 Indo Aus Americas Africa Eurasia Atlantic Polar Pacific-Indian
Comparison for 13 land regions between TM4 / SCIA differences and Lisa’s surface station optimizations per region Aug 2004
Comparison for 13 land regions between TM4 / SCIA differences and Lisa’s surface station optimizations per region Year 2004
Aug 2004 TM5 ‘B07’ post-prior CH4 column mixing ratio increments (ppmv) TM5 ‘BQT’ post-prior CH4 column mixing ratio increments (ppmv)
Jun 2004 TM5 ‘B07’ post-prior CH4 column mixing ratio increments (ppmv) TM5 ‘BQT’ post-prior CH4 column mixing ratio increments (ppmv)
Long runs (AC en C slides)
TM5 Preliminary CH4 budget analysis (year 2000) CH4 + OH (troposphere) 406 Tg/a <= 15% lower than TM4 (under investigation....) CH4 + OH (lower stratosphere) 20 Tg/a Stratospheric nudging 34 Tg/a more strat. loss (54 Tg) Burden change -12 Tg/a Net CH4 emission – soil sink 448 Tg/a • Prescribed (observed) zonal-mean mixing ratios at the surface • Above 50 (tropical)/90 hPa (extra-tropical) nudging to HALOE-CLAES climatology • Grooß and Russell III, Technical note: A stratospheric climatology for O3, H2O, CH4, NOx,HCl and HF derived from HALOE measurements, Atmos. Chem. Phys., 5, 2797–2807, 2005
Next months • Further evaluations sensitivity runs against observations • (SCIA, FTIR, surface) • TM4 run with a-posterior LPJ distribution Lisa? • Continuation of TM5 decadal runs 1989-1999 and 1999-2008 • ~ 3 days per simulation year => first set ready in May • Multi-annual CH4 budget / lifetime analysis based on TM5 • “separate concentration changes caused by lifetime change • from concentration changes caused by emission changes” • Analysis of meteorology 1989-2008 affecting interannual OH • (total ozone, temperature, humidity, solar radiation, clouds, albedo)