Download
1 / 48
600 likes | 1.24k Views
MBA 8503: Operations and Supply Chain Management. Matthew J. Liberatore Spring 2011. Welcome!. Introduction to Operations and Supply Chain Management. Class 1: 1/12/11. What is Operations and Supply Chain Management ?.

E N D
MBA 8503: Operations and Supply Chain Management Matthew J. Liberatore Spring 2011 Welcome!
Introduction to Operations and Supply Chain Management Class 1: 1/12/11
What is Operations and Supply Chain Management? Operations and Supply Chain Management is defined as the design, operation, and improvement of the systemsthat create and deliver the firm’s primary products and services 1-3
1-4 Operations and Supply Chain Management Supply Chain Processes Manufacturing Processes Sourcing Processes Distribution Processes Logistics Processes Logistics Processes Service Processes
Kmart Versus Wal-Mart • Both chains started in 1962 • In 1987, Kmart had 2,223 stores to Wal-Mart’s 1,198. • Kmart’s sales were $25.63 billion to Wal-Mart’s $15.96 billion • By 1991, Wal-Mart’s sales exceeded Kmarts • Kmart still had more stores
Kmart Versus Wal-Mart continued • In year ending January 1996, Wal-Mart’s sales were $93.6 billion to Kmart’s $34.6 billion. • During this time Kmart emphasized marketing and merchandising (such as national TV ad campaigns). • Wal-Mart was investing millions in its operations to lower cost.
Kmart Versus Wal-Mart continued • Wal-Mart developed sophisticated distribution system that integrated its computer system with its distribution system. • Kmart’s employees lacked skills needed to plan and control inventory.
Importance of Operations • Improvements in operations can simultaneously lower costs and improve customer satisfaction. • Improving operations often dependent on advances in technology. • Can obtain competitive advantage by improving operations.
Operations • Heart of every organization • Operations are the tasks that create value • Operations management uses resources to transform inputs into desired outputs
Systems Perspective • Inputs • Transformation System • Alter • Transport • Store • Inspect • Outputs • Environment
1-13 Automobile Factory • Primary Inputs • Sheet steel, engine parts • Resources • Tools, equipment, workers • Primary Transformation Function • Fabrication and assembly of cars • Desired Output • High quality cars
1-14 Hospital • Primary Inputs • Patients • Resources • MDs, nurses, drugs, equipment • Primary Transformation Function • Health care (diagnosis and treatment) • Primary Output • Healthy individuals
Facilitating Good Concept • Often confusion in trying to classify organization as manufacturer or service • Facilitating good concept avoids this ambiguity • All organizations defined as service • The tangible part of the service is defined as facilitating good • Pure Services
What Is a Supply Chain? Flow of products and services from: • Raw materials manufacturers • Intermediate products manufacturers • End product manufacturers • Wholesalers and distributors and • Retailers • Connected by transportation and storage activities • Integrated through information, planning, and integration activities • Cost and service levels
What Is Supply Chain Management? • Supply chain management is a set of approaches utilized to efficiently integrate suppliers, manufacturers, warehouses, and stores, so that merchandise is produced and distributed at the right quantities, to the right locations, and at the right time, in order to minimize system wide costs while satisfying service level requirements.
Two Other Formal Definitions The design and management of seamless, value-added process across organizational boundaries to meet the real needs of the end customer Institute for Supply Management Managing supply and demand, sourcing raw materials and parts, manufacturing and assembly, warehousing and inventory tracking, order entry and order management, distribution across all channels, and delivery to the customer The Supply Chain Council
PC Industry Supply Chain Tracing back the screen you stare at for the bulk of your time.
Material Flow Converter Retailer Supplier Distributor Source Converter Consumers Distributor End-User Supplier Value-Added Services Funds/Demand Flow Information Flow Reuse/Maintenance/After Sales Service Flow SCM Definition
The SCM Network FIGURE 1 The logistics network
Key Observations • Every facility that impacts costs need to be considered • Suppliers’ suppliers • Customers’ customers • Efficiency and cost-effectiveness throughout the system is required • System level approach • Multiple levels of activities • Strategic – Tactical – Operational
Other Related Observations • Supply chain strategy linked to the Development Chain • Challenging to minimize system costs and maximize system service levels • Inherent presence of uncertainty and risk
The Development Chain • Set of activities and processes associated with new product introduction. Includes: • product design phase • associated capabilities and knowledge • sourcing decisions • production plans
The Development Chain Figure 2 The enterprise development and supply chain
Global Optimization • Geographically dispersed complex network • Conflicting objectives of different facilities • Dynamic system • Variations over time • Matching demand-supply difficult • Different levels of inventory and backorders • Recent developments have increased risks • Lean production/Off-shoring/Outsourcing
Global Apparel Value ChainTracing back the dress you are wearing
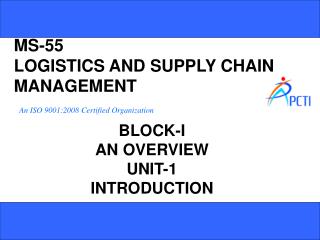
Product Design [Hong Kong] QC & Shipping [Hong Kong] Yarn Spinning [Korea] Weaving [Taiwan] Stitching [Indonesia] Zippers+… [Japan+…] Globally Dispersed Manufacturing An Illustration: How Li & Fung Limited Might Make a Dress
Uncertainty and Risk Factors • Forecasting is not a solution • Demand is not the only source of uncertainty • Recent trends make things more uncertain • Lean manufacturing • Outsourcing • Off-shoring
Uncertainty and Risk Factors • August 2005 – Hurricane Katrina • P&G coffee supplies from sites around New Orleans • Six month impact • 2002 West Coast port strike • Losses of $1B/day • Store stock-outs, factory shutdowns • 1999 Taiwan earthquake • Supply interruptions of HP, Dell • 2001 India (Gujarat state) earthquake • Supply interruptions for apparel manufacturers
Further Refinement of SCM Capabilities SCM Formation/ Extensions JIT, TQM, BPR, Alliances Inventory Management/Cost Optimization Traditional Mass Manufacturing 1950s 1960s Beyond 2000s 1970s 1990s 1980s Evolution of Supply Chain Management
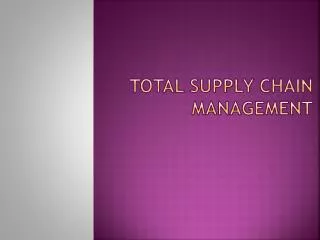
Progression of Logistics Costs FIGURE 1-4: Logistics costs’ share of the U.S. economy
Logistics Costs Trends • After rising over 50 percent in the five years leading up to the recession, total logistics costs have fallen the past two years. • Logistics costs in 2009 were equal to about $1.1 trillion – a drop of $244 billion (or 18.2) over 2008
Composition of Logistics Costs • Transportation costs were down more than 20 percent last year • Transportation costs now account for 4.9 percent of GDP, well below the 6 percent share in 2008. • Carrying costs accounted for 2.5 percent of GDP in 2009, down from 2.9 percent in 2008 and well off the 8.3 percent of GDP in 1981
Complexity: The Magnitude • The grocery industry could save $30 billion (10% of operating cost) by using effective logistics strategies • A typical box of cereal spends 104 days getting from factory to supermarket. • A typical new car spends 15 days traveling from the factory to the dealership.
Complexity: The Magnitude • Compaq computer’s loss of $500 million to $1 billion in sales in one year • Laptops and desktops were not available when and where customers were ready to buy them • Boeing’s forced announcement of write-downs of $2.6b • Raw material shortages, internal and supplier parts shortages…. • Cisco’s multi-billion ($2.2b) dollar write-off of inventories in 2001-2002 • Customers balked on orders due to market meltdown
Transactional Complexity National Semiconductors: • Production: • Produces chips in six different locations: four in the US, one in Britain and one in Israel • Chips are shipped to seven assembly locations in Southeast Asia. • Distribution • The final product is shipped to hundreds of facilities all over the world • 20,000 different routes • 12 different airlines are involved • 95% of the products are delivered within 45 days • 5% are delivered within 90 days.
Magnitude of Supply Chain CostsCost Elements of a Typical Trade Book
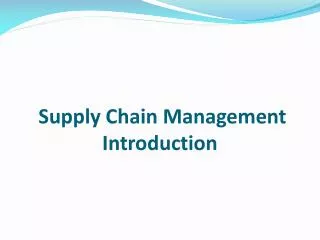
Cost per Percent Shirt Saving $52.72 0% $41.34 28% $20.45 62% Retailer Customer Manufacturer Distributor Manufacturer Retailer Customer Distributor Retailer Customer Manufacturer Distributor Magnitude of Supply Chain CostsExample: The Apparel Industry
Supply Chain: The Potential • P&G’s estimated savings to retail customers of $65 million through logistics gains • Dell Computer’s outperforming of the competition in terms of shareholder value growth over more than two decades by over 3,000% using: • Direct business model • Build-to-order strategy • Wal-Mart transformation into the world’s largest retailer by changing its logistics system: • highest sales per square foot, inventory turnover and operating profit of any discount retailer
KAPLAN AND NORTON’S (2006) OPERATION S STRATEGY AND THE BALANCED SCORECARD