Download

1 / 15
210 likes | 389 Views
Statistics Of Two Variables. By: Gurvinder, Jot, Dap, and Karan. 3.1-Scatter Plots And Linear Correlations.

E N D
Statistics Of Two Variables By: Gurvinder, Jot, Dap, and Karan
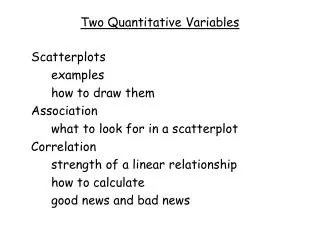
3.1-Scatter Plots And Linear Correlations • Scatter Plot: A graph in which data is plotted with one variable on the x-axis and the other on the y-axis. The pattern of the resulting points can show the relationship between the two variables. • Looking at the visual pattern in the scatter plot can reveal a relationship between the two variables • The independent variable affects the dependant variable. • Linear Correlation: a relationship in which changes in one variable tend to be proportional to the changes in the another.
Covariance It’s the mean of the product of two variables.
Correlation Coefficient A number which measures the strength of the linear correlation. It also measures how close the data points are to the line of best fit (LOBF).
Correlation Coefficient Con’t Interpreting the correlation coefficient:
3.2- Linear Regression • Regression: is an analytical technique for determining the relationship between two variables (independent and dependant). • For a linear regression you had to find the LOBF but now you have to use the least squares formula to get an accurate LOBF. • The least squares formula is • y=ax+b • Where a = the slope and b = the y-int.
3.3- Non-Linear Regression And Curve Of Best Fit • Not all relations are going to be linear relations. Some are non-linear patters. These include: • Population growth • Radioactive decay • Projectile motion • Global warming
Coefficient of determination: r2 • r2 is a number which describes how closely a graph is to the COBF. • Helps us determine the fit of a non-linear model.
Types Of Regressions Linear Sin Y=asin[k(x-d)]+c Y=ax+b Y=ax2+bx+c Cubic Y=ax3+bx2+cx+d Y=abx Y=axb Power
3.4 Cause and Effect • The main reasons of doing a study with statistics is to find evidence of a cause and effect relationship • Example 1: A health researcher may wish to prove that even mild excersise reduces the risk of heart cancer • Example 2:A school board may want to know whether calculators help students learn math • In each of these examples to determine the strong correlation between the variables is a first stage on figuring out if one affects the other
Types of Relationships • Cause & Effect Relationship: A change in the independent x variable produces a change in the y variable The height of the ball v.s. the impact velocity • Common Cause Factor: An external variable is the real cause for the two unrelated variable to change together The sales of ice cream and winter boots is found to have a negative correlation
Types of Relationships Con’t • Reverse Cause & Effect Relationship: The dependant and independent variables are reversed Student observes a high correlation between amount of coffee consumed by a group of students and their corresponding level of anxiety • Accidental Relationship: A correlation exists without any casual relationship between variables Sales of cellular phones had a strong negative correlation with ozone levels in the atmosphere over the last decade • Presumed Relationship: A correlation does not seem to be accidental even though no cause and effect relationship or common cause factor is apparent Leadership ability has a positive correlation with academic achievement
3.5 Critical Analysis Must be careful on analyzing stats that are flawed or bias ( unintentionally or intentionally) Things like advertisers, lobby groups and political organizations You should examine the sources of data, sampling methods, Analysis techniques applied as well as motivations and agenda of authors