Download
1 / 33
340 likes | 520 Views
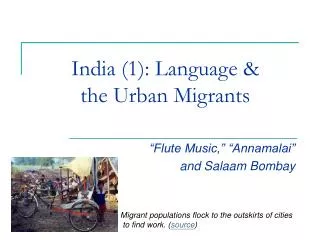
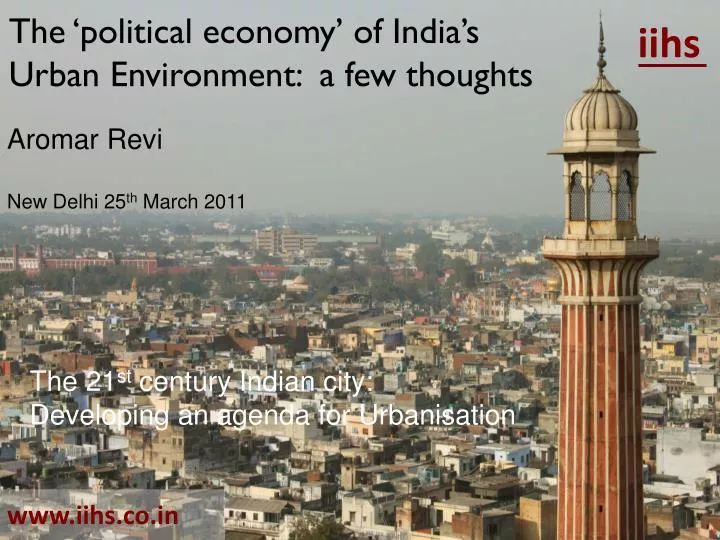
iihs. The ‘political economy’ of India’s Urban Environment: a few thoughts. Aromar Revi New Delhi 25 th March 2011. The 21 st century Indian city: Developing an agenda for Urbanisation. www.iihs.co.in. Mumbai: minimum city…. Slums in the City. Mumbai: a cross-section of Slums.

E N D
iihs The ‘political economy’ of India’s Urban Environment: a few thoughts Aromar Revi New Delhi 25th March 2011 The 21st century Indian city: Developing an agenda for Urbanisation www.iihs.co.in
Slums in the City Mumbai: a cross-section of Slums Ekvira Nagar, Salt pan land Bharat Nagar and other slums, Raoli Junction Near Airport Ganesh Murty Nagar
Mumbai’s Slum Services: Water Supply Bharat Nagar Shanti Nagar Chikhalwadi Dharavi Ambedkar Nagar
Mumbai’s Slum Services: Solid Waste Garbage dumping place, Andhra Association Garbage Bin, Near Khotwadi Unhygienic surroundings, Anna Nagar Clean Street, Dadabhai Chawl
Mumbai’s formal & informal Land Price differentials Mumbai’s (imputed) land market value estimated in 2005 at ~ Rs. 560,000 crores. Distortions in this market primary factor in the huge (55%+) city slum population
Outcome Mumbai: the slum capital of the world • 7 million+ people living in ‘slums’ • Dysfunctional land & housing markets • Declining quality of public services & security • Tardy transformation of landuse & economic functions • Declining quality of governance • Ecological footprints expanding across the subcontinent • Steady decline in resource-use efficiency • Increasing polarisation of wealth this is clearly unsustainable …
RECOMMENDED CONCEPT OPTION: MMR 2031 “City Of Islands”
UN World Urbanisation Prospects, 2007 Urbanisation trends: India, China & the USA (1950-2050) India: an dramatic opportunity forbalanced RUrban development
Global Health Risk forecast by risk factor (2005-2060) Source: Hughes et. al., 2011, Improving Global Health, Forecasting for the next 50 Years
1951 Tibet W. Pakistan Nepal E. Pakistan India Population Size (millions) < 0.1 0.1 – 0.5 0.5 - 1 1 - 5 > 5 Source: Census of India, 1971- 2001 UN, 2007 IIHS analysis, 2009-10
2011 Delhi (16.9) Urban Population Growth Ahmadabad (5.7) Kolkata (15.5) Mumbai (20) Hyderabad (6.7) Population Size (millions) Pune (5.0) < 0.1 0.1 – 0.5 0.5 - 1 Bangalore (7.2) 1 - 5 Chennai (7.5) > 5 Source: Census of India, 1971- 2001 UN, 2007 IIHS analysis, 2009-10 Large Urban Settlement Growth
2031 Delhi (24.4) Urban Population Growth Kanpur (5.1) Ahmadabad (8.5) Kolkata (22.3) Surat (6.3) Mumbai (28.6) Hyderabad (9.9) Population Size (millions) Pune (7.4) < 0.1 0.1 – 0.5 0.5 - 1 Bangalore (10.6) 1 - 5 Chennai (11.1) > 5 Source: Census of India, 1971-2001 UN, 2007 IIHS analysis, 2009-10 Large Urban Settlement Growth
Rs 735 lakh crores Rs. 1450 lakh crores
Indian Cities & the global 21st century Sustainability transition
Present consumption requires ~2.0 worlds • 21st century Population growth needs 1.5+ worlds Available only One World • Ending poverty at present throughput ~2.0 worlds The Challenge of the 21st century Sustainability Transition This transition will be played out in Indian & Chinese cities
20th century pre-emption of ‘ecological space’ (1900-2004) ∆ Order of Magnitude + Cumulative Carbon emissions over the 20th century potentially pre-empts ecological & hence human development ‘space’ in the global South
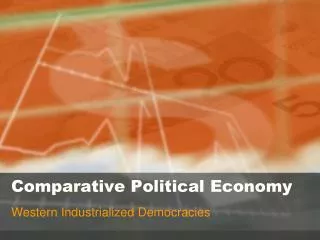
Can Services-sector led growth enable a Sustainability Transition? Services-sector growth led to very different outcomes in the US, Japan & Germany. China has chosen a conventional manufacturing-export led strategy unlike India
Ecological Footprint vs. HDI (1975) ‘Sustainable Development’ The ‘holy grail’ of national Sustainable Development aHDIof ~0.9 &Ecological Footprint of1 global Ha/per capita
The Sustainability transition will be fought & won in cities Early 21st century ‘tunnelling through’ will be foughtand won in Asianand‘emerging economy’urban areas and around new metabolisms, economies andsufficiencies
Future History - Sustainability Transitions: 2005 ‘Sustainable Development’ Can China traverse theenvironmental Kuznets curve; Germany & USA converge withoutserious Human Development declineIndia ‘tunnel through’; or will there be serious international ‘resource’ conflict?
India’s Settlement structure matched to deliver Climate adaptation & mitigation co-benefits Revi, 2010 ~ 7,800 urban areas and ~ 0.55 million rural settlements in 20011 – the opportunity for decentralised production and consumption systems and economic structure
Catalysing five national outcomes by the 2030s ‘Inclusive’ Economic Growth Reduced Poverty and Inequality Social Transformation Environmental Sustainability Unified & Robust Polity
Who really ‘manages’ Urban India? • Top Management • MPs & MLAs 5,300 • Higher Judiciary 650 • IAS & IPS 8,200 • CXOs (top 500 corporates) ~ 5,000 • NGO leadership ~ 1,750 • Total 20,900 • % educated & trained in urban practice < 5% • Middle Management • Senior Municipal officials ~ 4,000 • Senior Engineers ~ 8,000 • Urban Planners ~ 2,000 • Total ~ 14,000 • % educated & trained in urban practice < 20%