Download
1 / 28
280 likes | 415 Views
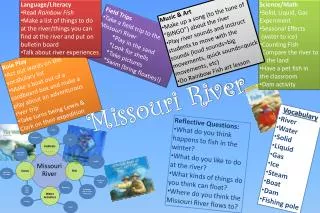
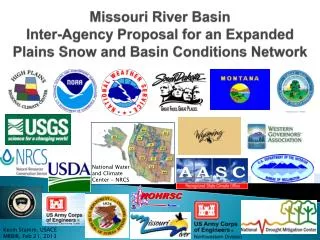
Missouri River Valley Air Toxics Trends on Tribal Lands. Leland P. Grooms Environmental Scientist US EPA Region VII. Background: In a nation endowed with magnificent water resources, the Mississippi and Missouri River Valley Watersheds are unparalleled.

E N D
Missouri River Valley Air Toxics Trends on Tribal Lands Leland P. Grooms Environmental Scientist US EPA Region VII
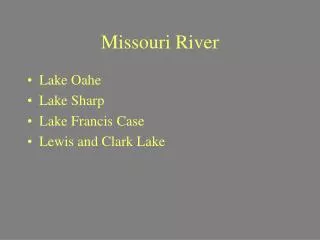
Background: In a nation endowed with magnificent water resources, the Mississippi and Missouri River Valley Watersheds are unparalleled. Value: Commercial navigation, recreation, fish, and wildlife all flourish within the Watershed. In addition, millions of residents rely on basin water for public and industrial supplies, power plant cooling, wastewater assimilation, and other uses. Tribal StrategyMissouri River Valley
The United States Environmental Protection Agency (EPA) Region 7 has oversight in Nebraska, Iowa, Kansas and Missouri. These parameters contain nine sovereign Tribal Nations. All but one of these Tribal nations are located within the Missouri River Valley. Tribal StrategyMissouri River Valley
EPA Region 7Tribal Communities • Kansas Prairie Band of Potawatomi Indians • Kickapoo Tribe in Kansas • Sac & Fox of Missouri in Kansas and Nebraska • Iowa Tribe of Kansas and Nebraska • Nebraska Omaha Tribe of Nebraska • Winnebago Tribe of Nebraska • Santee Sioux Tribe of Nebraska • Ponca Tribe of Nebraska • Iowa Sac & Fox Tribe of the Mississippi in Iowa (Meskwaki Nation)
Tribal StrategyMissouri River Valley • Current Status: National Air monitoring data has show several peak areas of pollutants along the Missouri River Valley and area encompassing several Tribal Nations. • There are several gaps in the area surrounding the Missouri River Valley involving air monitoring data. • EPA Headquarters has expressed a desire to increase the national air toxics monitoring network on Tribal Lands.
Understand Current Data Location/Legitimate need according to the data Tribal Public Health Concerns Higher incidents of lung disease Higher consumption of fish & other wildlife Encourage program development and interaction with federal/state and local programs Look at existing monitoring data Locate additional air and air toxics monitors Develop modeling strategies Why
Projected Goals • Make available current and past information for individuals living on Tribal Lands concerning air pollution and public health. • Analyze past, current and future data to try to define and explain high trends and patterns of certain pollutants. • Use modeling resources to approach the study on different levels.
Parameters involved in study. Ammonia Nitrate Ammonia Sulfate Fine Particulate Mercury Deposition Measured Pollutants
500 Largest SO2 Emitters in 1999 NEI * Account for 89% of the SO2 emissions from the 28,975 facilities that reported.
IMPROVE ReportNovember 2006 Spatial and Seasonal Patterns and Temporal Variability of Haze and its Constituents in the United States: Report IV November 2006
IMPROVE ReportNovember 2006 Spatial and Seasonal Patterns and Temporal Variability of Haze and its Constituents in the United States: Report IV November 2006
Spatial averaging of rural sulfate concentrations. NATIONAL AIR QUALITY AND EMISSIONS TRENDS REPORT, 2003 SPECIAL STUDIES
Spatial averaging of rural nitrate concentrations. NATIONAL AIR QUALITY AND EMISSIONS TRENDS REPORT, 2003 SPECIAL STUDIES
Mercury Deposition from All US and Canadian Sources in 2001 Source: US EPA 2005 using Community Multiscale Air Quality model.
Mercury Deposition From USPower Plants in 2001 Source: US EPA 2005 using Community Multiscale Air Quality model.
EPA Region VII Toxic Air Monitoring Blue-Tribal land Orange-Tribal IMPROVE, Yellow-State IMPROVE, Green-CASTNET
Conclusion • Substantial levels of Air Pollutants in Tribal Areas • Regional Haze • Ammonia Nitrate • Ammonia Sulfate • Mercury • Fraction estimation for extrapolation • Fine Mass • Mercury Deposition
Contact Information • Leland P. Grooms US EPA Region VII 913 551-7124 Grooms.leland@epa.gov