Download
1 / 23
230 likes | 239 Views
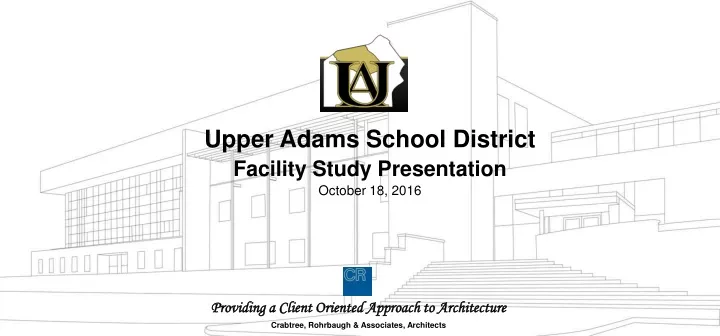
This presentation provides a client-oriented approach to architecture and covers current assessments, enrollment analysis, building capacity analysis, renovation costs, proposed planning, facility options, financial discussion, and schedule/decision making.

E N D
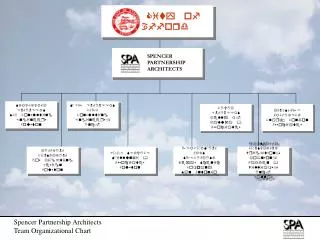
Upper Adams School District Facility Study Presentation October 18, 2016 Providing a Client Oriented Approach to Architecture Crabtree, Rohrbaugh & Associates, Architects
Agenda • Part 1 – Current Assessments • Purpose & Goals • Enrollment Analysis • Building Capacity Analysis • Renovation Costs / Approach • Building Evaluations • Part 2 – Proposed Planning • Costs / Upgrades to Current Standards • Facility Options / Option Costs • Financial Discussion • Schedule / Decision Making
Purpose Introduction: • This report should be viewed as a starting point, or benchmark • This report provides a framework from which both a short and long term facilities master plan can be implemented for any recommended or desirable facility improvements. • The essence of the long range master plan will be to determine the number, type and location of school facilities that will be needed during the next decade and beyond.
Enrollment How is enrollment projected? What are the different methods of projecting enrollment? What are the trends within the district? What is a reliable projection?
Enrollment Upper Adams SD / K – 12 Student Population Trend: What is the District’s K-12 Student Population Trend ? Historic Trends - • Consistent decrease in the student population over last several years
Enrollment Local (District) and District K-12 Population Trends: How does the Local (District) and District K-12 population compare with 2020 projections ? Methodology Analysis A - Percentage of students to Local (District) population Historic Trends - • Consistent decrease in the student population percentage over last several years • Continuing this declining percentage ratio, 2020 & 2025 projections dictate enrollment projections similar to PDE’s projections • PDE 2020 projection = 1,589 difference of 52 students – the equivalent of two (2) classrooms district wide
Enrollment District K-12 Population Trends: How does the Local (District) and District K-12 population compare with 2020 projections ? Methodology Analysis B – Pa Department of Education Projections Projections - • Methodology B – % of students to Local (District) population – 2020 = 1,589
Enrollment District K-12 Population Trends – Current Grade Groupings: What are Student Enrollment Trends and Projections for the Current Grade Groupings ? Projections – K -3, 4 – 6 (5 year average) • Student Enrollment trends as a percentage of Total K-12 Enrollment projects enrollment for 2020 and 2025
Enrollment District K-12 Population Trends – Current Grade Groupings: What are Student Enrollment Trends and Projections for the Current Grade Groupings ? Projections - 7 – 8, 9 – 12 (5 year average) • Student Enrollment trends as a percentage of Total K-12 Enrollment projects enrollment for 2020 and 2025 5 Year Average Total 2020 Projected Enrollment = 1,659 PDE Total 2020 projected Enrollment = 1,589
Building Capacity How many students can each building accommodate? Is there adequate space for support programs? Are there collaborative learning environments? Do we have room to grow and offer new programs?
BuildingCapacity Building Capacity as it relates to Enrollment Projections – by Grade Group What is the capacity of existing buildings based on Current Use of Space ? Building Capacity - • Based on four (4) methodologies analyzed to project District K-12 enrollments • Utilization rates dictate how full a respective building is with regard to enrollment vs current building capacity • PDE model which utilizes 25 students per classroom for reimbursement calculations
BuildingCapacity 91% Building Capacity - CURRENT • Biglerville, Arendtsville, Bendersville ES – ALL are at maximum utilization 90% 99% 84%
BuildingCapacity Building Capacity as it relates to Enrollment Projections – by Grade Group What is the capacity of existing buildings based on Planned Use of Space ? Building Capacity - • Based on four (4) methodologies analyzed to project District K-12 enrollments • Utilization rates dictate how full a respective building is with regard to enrollment vs current building capacity
BuildingCapacity 77% Building Capacity - PLANNED • With the addition of just four (4) general classrooms in the elementary buildings in a planned use of space significantly drops the utilization rates 75%
Renovation Costs Facility Study level estimates for planning and decision CRA Historical cost data Compliance with building codes Expectation to meet current construction standards to qualify for reimbursement – 20 year cycle Board controls cost of the project based upon approved scope of work
Base Line Renovation Costs • Purpose of establishing Base Line Develop an understanding of the work required to bring existing school facilities up to current construction standards – Pa Dept. of Education • Qualify for potential state reimbursement (20 Year cycle) • Develop systematic approach to Study • Identify Guiding Principles • Comprehensive Renovations Throughout • Building Systems; HVAC, Electrical, Plumbing, Technology • Apples to Apples comparison for all school buildings Base Line Renovation Costs DO NOT address: Additional Building Area for Educational Program/Capacity
Renovation Costs & Approach Comprehensive SCOPE VS. Reduced SCOPE Scope determines budget Budget determines scope EXAMPLES: Building reorganization Maintain current organization New Ed Program additions Minor/ No new additions Address ALL site work items Prioritize LDP approval Replace ALL: Interior finishes Reduced replacement of finishes Casework Limited area Bldg. Envelope Prioritize by budget Replace ALL Mechanical/Elec. Systems Upgrade Mechanical Systems 4 Pipe System 2 Pipe or VAV System Preferred ATC Controls Basic ATC Controls Fully Air Conditioned Limited Air Conditioning New Lighting Fixtures Retrofit Existing Lighting Lower Operating Costs Higher Operating Costs
Base Line Renovation Costs Influencing factors • Scope of Work, i.e. HVAC system selection • Scale of the project • Timing of the project • Duration of the project; phasing etc. • Building / Municipal Requirements • Equity among buildings • Other ? Detailed written reports contained within the study
Building Evaluations Building Evaluations What is the current physical condition of each of the District buildings and assessment of site location? Site Assessment* Scale : 1 – Poor; 3 – Fair; 5 - Good Arendtsville ES Bendersville ES Biglerville ES MS/HS General Condition 5 3 5 5 Site Circulation 4 2 4 4 Entrance / Access 4 3 3 4 Parking 3 1 3 4 Site Size** 5 (16.5/13) 1 (4.5/12) 5 (88/16) 4 (35/45) Expansion Capability 5 1 5 3 Total average SITE assessment 4.3 1.8 4.2 4 *This site/building evaluation chart reflects a similar facility appraisal process as developed by the Council of Educational Facilities Planners International ** (actual site acreage / optimal acreage per PDE guidelines) – typical all site sizes listed above Building Site Assessments - • Based on six (6) criteria analyzed to project total site condition ranging from poor to good • Subjective assessments • Detailed written reports documenting conditions
Building Evaluations Building Evaluations What is the current physical condition of each of the District buildings and assessment of site location? Building Condition Scale : 1 – Poor; 3 – Fair; 5 - Good Arendtsville ES Bendersville ES Biglerville ES MS/HS Building Identity 4 4 4 4 Roof 3 3 5 4 Storefront Entrances 2 2 5 4 Windows 2 2 4 4 Energy Efficiency 3 3 4 4 Exterior Wall 3 3 4 5 Structural Integrity 4 4 4 5 Exterior Environment 3 3 4.3 4.3 Educational Adequacy 3 3 4 4 Classroom/Core Size 2 2 4 4 ADA/Toilet 2 2 5 4 Finishes 3 3 5 4 Floors/Ceilings 3 3 5 4 Furnishings/Equip 3 3 5 4 Structural Integrity 4 4 5 5 Interior Environment 2.9 2.9 4.74 *This site/building evaluation chart reflects a similar facility appraisal process as developed by the Council of Educational Facilities Planners International Building Condition Assessments - • Based on criteria analyzed to project total building condition ranging from poor to good • Subjective assessments
Building Evaluations Building Evaluations What is the current physical condition of each of the District buildings and assessment of site location? Building Systems Scale : 1 – Poor; 3 – Fair; 5 - Good Arendtsville ES Bendersville ES Biglerville ES MS/HS Mechanical / HVAC 4 4 4 5 Plumbing 3 3 4 4 Electrical 3 3 4 5 Building Systems 3.3 3.3 4 4.7 Total average Bldg Condition Assessment 3.1 3.1 4.3 4.3 *This site/building evaluation chart reflects a similar facility appraisal process as developed by the Council of Educational Facilities Planners International Building Condition Assessments - • Based on criteria analyzed to project total building condition ranging from poor to good • Subjective assessments
Next Step Enrollment Assessment What number to plan for? Enrollment & Building Capacity Analysis Identify where space is needed Educational Program Determine if new additions are needed Assemble Cost Estimates Review Preliminary Options Discuss timeline for decision making Purpose of the Study is to Prioritize Projects and develop a schedule which meets the Districts financial expectations
Upper Adams School District Questions? Providing a Client Oriented Approach to Architecture Crabtree, Rohrbaugh & Associates, Architects