Download
1 / 26
260 likes | 382 Views
Learn about scatter plots, least square lines, covariance, correlation coefficients, and more in Minitab. Understand how to interpret data relationships and compute statistical measures accurately.

E N D
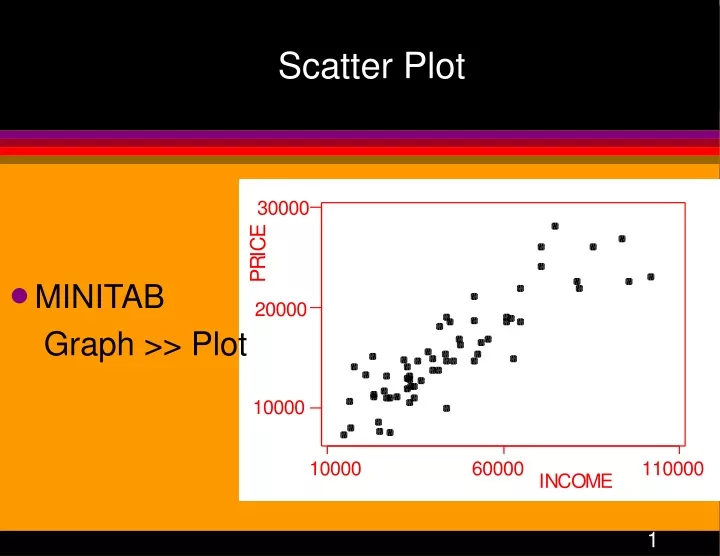
Scatter Plot • MINITAB Graph >> Plot
Linear Relationship and Error y y = b0 + b1 x yi x xi
Least Square (LS) Line • Line: • Error: • Sum of Squares of Error: • LS intercept and slope are obtained by minimizing SS Error with respect to b0 and b1
Facts About the LS Line • LS slope: Slopeb1 and correlation rhave the same sign • LS intercept:
More Facts About the LS • LS line passes through the averages • The average of LS fits is • The average of LS residuals is
Example of LS Line • MINITAB Stat >> Regression >> Fitted line plot
Another Example of LS Line • MINITAB Stat >> Regression >> Fitted line plot
Positive Association • Lines of averages INCOME
Negative Association • Lines of averages RENT PER SQFT FOOTAGE
Covariance, Cov(x,y) • Expected value of the cross-productterms of deviations from the means: sx,y= E [(x - mx)(y - my)] • Sample covariance
Some Remarks about Covariance • Cov(x,y) = Cov(y,x) • Covis a measure of linear relationship between x and y • No linear relationship, Cov(x,y) = 0 • Positive slope, Cov(x,y) > 0 • Negative slope, Cov(x,y) < 0 • Covdepends on the units of measurement of the two variables • Cov(x,x) = Var(x)
Correlation Coefficient, Corr(x,y) • Correlation coefficient • Sample correlation coefficient • An average of the cross-product of the standardize values of the two variables
Example of Positive Association Cov(x,y) = 92073109 Corr(x,y) = 0.875 INCOME
Example of Negative Association RENT PER SQFT Cov(x,y) = -16.242 Corr(x,y) = -0.456 FOOTAGE
Bivariate Data • Pair of variables: x =Explanatory, predictor, or independent variable • income of an individual y =Response variable or dependent variable • price of an item purchased by the individual • Data: (x1,y1), (x2,y2), . . . , (xn,yn) individual 1 individual 2 individual n
Perfect Positive Correlation r = 1 y = 5 + 3x
Perfect Negative Correlation r = -1 y = 5 - 2x
Perfect Linear Relationships, r2 = 1 Corr = - 1 Corr = 1
A Measure of Fit of the Line to Data • 0 < R2< 1 • R2 = 1 implies the perfect fit of data to LS line • R2 = 0 indicates no fit • Percent of variation of yiexplained by xi
Perfect Relationship, But Zero Correlation Corr = 0 y = (x - 3)2
Remarks about Correlation Coef. • Corr(x,y) is a unit free index of linear relationship between the two variables • Corr(x,y) = Corr(y,x) • Corrdoes not change when: • any of the two variables is multiplied by a positiveconstant • both variables are multiplied by negative constants • a constant is added to each variable • The sign of Corrchanges if oneof the variables is multiplied by a negative constant
Computation in MINITAB • Stat >> Basic Statistics >> Covariance INCOME PRICE INCOME 435696626 PRICE 92073109 25405637 Variances Covariance • Stat >> Basic Statistics >> Correlation Correlations (Pearson) Correlation of INCOME and PRICE = 0.875