Download
1 / 7
70 likes | 88 Views
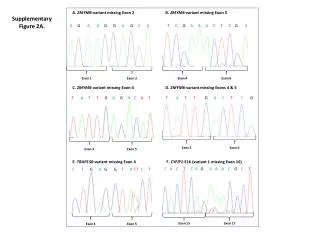
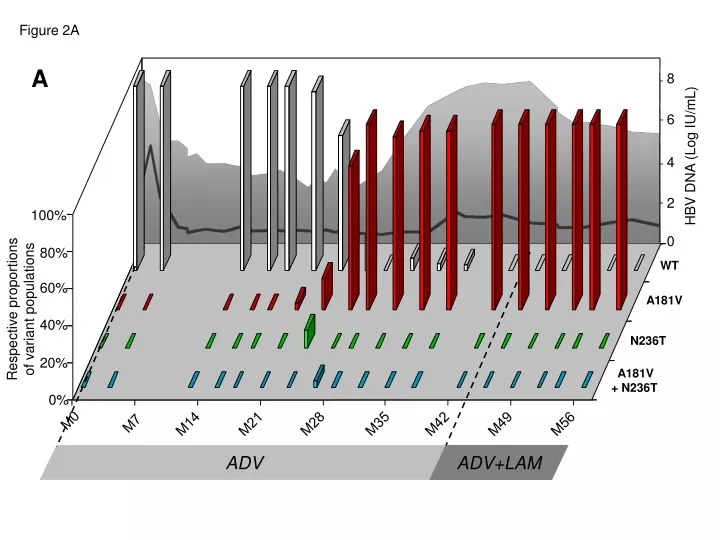
Examination of HBV DNA levels and variant populations in response to treatment with relevant mutation proportions for A181V and N236T.

E N D
Figure 2A A 8 6 HBV DNA (Log IU/mL) 4 2 100% 0 80% WT 60% Respective proportionsof variant populations A181V 40% N236T 20% A181V + N236T 0% M0 M7 M14 M28 M35 M21 M42 M49 M56 ADV ADV+LAM
Figure 2B 10 B 8 6 HBV DNA Log IU/mL 4 2 0 100% WT 80% A181V 60% Respective proportionsof variant populations N236T 40% A181V + N236T 20% A181T + N236T 0% M0 M5 M10 M15 M20 M25 M30 M35 M40 M45 ADV ADV+LAM
Figure 2C 10 C 8 6 HBV DNA Log IU/mL 4 2 0 100% WT 80% A181V Respective proportionsof variant populations 60% A181T 40% N236T 20% A181V + N236T 0% M0 M5 M10 M15 M20 M25 M30 M35 M40 M45 ADV
8 D 6 HBV DNA (Log IU/mL) 4 2 100% 0 WT 80% A181V Respective proportionsof variant populations 60% A181T 40% N236T A181V+ N236T 20% A181T + N236T 0% M0 M5 M10 M15 M20 M25 ADV Figure 2D
Figure 2E 8 E 6 HBV DNA (Log IU/mL) 4 2 0 100% WT 80% A181V 60% Respective proportionsof variant populations N236T 40% A181V + N236T 20% A181T + N236T 0% M0 M7 M14 M21 M28 M35 M42 ADV+LAM ADV ADV
Figure 2F F 8 6 HBV DNA (Log IU/mL) 4 2 0 100% WT 80% A181V 60% Respective proportionsof variant populations N236T 40% A181V + N236T 20% A181T + N236T 0% ADV M0 M10 M20 M30 M40 M50 ADV
Figure 2G G 10 8 HBV DNA (Log IU/mL) 6 4 2 100% 0 WT 80% A181V 60% Respective proportionsof variant populations 40% A181T 20% N236T 0% M0 M7 M21 M42 M48 M28 M35 M14 ADV ADV ADV+LAM