Download
1 / 45
450 likes | 462 Views
This document provides a summary of the modeling protocol for assessing air quality and health impacts in Southern California using photochemical and meteorological models. It includes information on model input preparation, modeling results, and the choice of models used.

E N D
California Environmental Protection Agency Air Resources Board Regional Modeling Update Ajith Kaduwela, Ph.D Luis F. Woodhouse, Ph.D. September 12, 2002
Collaborators • Emissions • Paul Allen, P.E. • Emissions Inventory Branch • Meteorology • Shuming Du, Ph.D. • Kemal Gurer, Ph.D. • Daniel Chau, Ph.D • Air Quality • Luis Woodhouse, Ph.D. • Jinyou Liang, Ph.D. • Chemistry • Bruce Jackson, M.S.
Outline • Summary of Draft Modeling Protocol • Photochemical Models Used • Model Input Preparation • Meteorological Models Used • Modeling Results/Performance Evaluation • MATES-II, CRC/DOE/NERL Study • Future Work
Summary of Modeling Protocol • Modeling Approach: • Apply air quality models to assess health impacts from direct inhalation at both micro and regional scale. • Micro-scale modeling for near source impacts • Regional scale to simulate transport of pollutants from all emission sources in Southern California
Modeling Protocol (cont.) • Simulate air quality from January 1 to December 31, 1998 • Modeling Domain • 87 x 67 cells • 4 x 4 km2 grid size
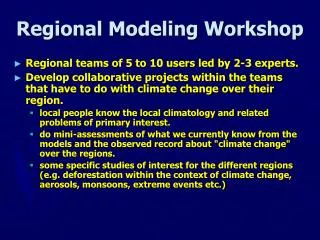
Ventura San Bernardino Los Angeles Riverside Orange San Diego Mexico Regional Modeling Domain
Modeling Protocol (cont.) • Emissions • Seasonal weekend and weekday inventories instead of monthly • Total of 8 emission inventories • Chemical Mechanism • SAPRC-99 • Modified to include additional toxics
1,3-butadiene Formaldehyde Acetaldehyde Acrolein Benzene Carbon tetrachloride Chloroform Dichloromethane 1,2-Dichloroethane o-Dichlorobenzene p-Dichlorobenzene Ethylene oxide Styrene Toluene Trichloroethylene Vinyl Chloride Xylenes Diesel PM10 Arsenic Beryllium Cadmium Hexavalent Chromium Iron Lead Manganese Mercury Nickel Zinc Toxics
Modeling Protocol (cont.) • Two grid-base photochemical models • Run Models-3/CMAQ for selected episodes • Run one air quality model for entire 1998 • using CALGRID instead of UAM-FCM
Air Quality Model Change • Why not UAM-FCM? • Based on older version of UAM (UAM-IV) • No longer supported • Chemical solver difficulties • Why CALGRID? • Better formulation than UAM-IV • Better documentation • Flexible chemical mechanism
CALGRID • Grid-based photochemical model developed in 1989 for ARB and last updated in 2000 (Version 1.6b) • Choice of chemical mechanisms (CB4 or SAPRC) • ARB’s implementation of a flexible chemical mechanism interface
Community Multiscale Air Quality Modeling System Models-3/CMAQ • Photochemical air quality model first released in 1999 with EPA funding. • State-of-the-Science but limited use to date • Continually under development • Aqueous-phase chemistry, aerosol dynamics and modal size distributions, aerosol deposition, plume chemistry, and process analysis
CMAQ MM5 17 vertical layers Domain top: 14.6 km SAPRC-99 with toxics QSSA or SMVGEAR dry deposition for some toxic VOCs first order decay for deposition of PM 7 days of CPU/month 1 GB/day CALGRID CALMET 10 vertical layers Domain top: 3 km SAPRC-99 with toxics QSSA or Hybrid dry deposition for all toxic VOCs particulate deposition for PM 3 days of CPU/month 0.5 GB/day CMAQ vs. CALGRID
Model Input Preparation • Initial and Boundary Conditions • Emissions • Meteorology
Initial and Boundary Conditions • Initial and Boundary conditions same for each month • Boundary conditions same as for SCOS-97 • EPA Clean over ocean (40 ppb O3, 0.001 ppb NOx, and 20 ppbC VOC) • South Coast clean over land (40 ppb O3, 2 ppb NOx, 60 ppbC VOC) • MATES-II • 40 ppb O3, 1.5 ppb NOx, 30 ppbC VOC
Emissions • Based on inventories developed for SCOS-97, adjusted to 1998 • Weekend and weekday inventories by season • Using latest profiles, and surrogates to spatially allocate emissions • Use latest version of EMFAC2000 for motor vehicle inventory with DTIM4
Weekend and Weekday Area Source Emissions Winter and Summer 1998 tons/day
Summer Weekday NO 0 hr 6 hr Levels (kg/hr): 1 (B) 10 (G) 50 (Y) 80 (O) 100 (R) 16 hr 12 hr
Summer Weekday BENZENE 0 hr 6 hr Levels (kg/hr); 1 (B) 2 (G) 3 (Y) 4 (O) 5 (R) 16 hr 12 hr
Summer Weekday DIESEL PM10 0 hr 6 hr Levels (kg/hr): 1 (B) 3 (G) 4 (Y) 5 (O) 6 (R) 16 hr 12 hr
Meteorology • Models require hourly meteorological data for each grid in domain • Models needed to create gridded meteorological fields • Prognostic: predicts from first principles, mass and energy transfer equations (MM5) • Diagnostic: uses observational data (CALMET)
NCAR/Penn State Mesoscale Model (MM5) • Advanced state-of-the-science prognostic regional model • solves conservation equations to predict winds and temperatures • requires initial conditions, and boundary conditions for each hour simulated • Applied with one coarse and one nested domain
MM5 (cont.) • Analysis nudging used but no Data assimilation (FDDA) • 27 vertical layers (matched to 17 for air quality simulations) • MM5 exercised for entire 1998
CALMET • Diagnostic generation of meteorological fields with objective analysis • Parameterized treatments of slope flows, kinematic terrain effects, terrain blocking effects, and a micro meteorological model for overland and overwater boundary layers
CALMET (cont.) • Model driven by observations • 10 National Weather Service surface sites • ~100 California Irrigation Management System (CIMIS) surface stations • One upper air (NWS) site and two buoys • ~60 surface ARB/District monitoring sites (for January and August only)
Model Output Example: August 5, 1998 @ 12:00hrs CALMET MM5
Model Output Example: January 20, 1998 @ 12:00hrs CALMET MM5
Model Performance Evaluation • Process of establishing that an air quality model is adequately reproducing the chemical and physical processes that generate and transport pollutants (“right answer for the right reason”) • Spatial and temporal evaluations needed
Model Performance Evaluation • Procedures well established for episodic hourly concentrations of O3 • peak estimation accuracy, mean bias, variance, gross error, scatter plots, time series plots, and isopleths • diagnostic and sensitivity simulations • No procedure established for 24-hr or annual concentrations
Model Performance Evaluation (cont.) • Approach: • Hourly evaluation of selected episodes for O3, NOx, and CO using ARB guidance • Several days to monthly evaluation of O3, NOx, CO, toxic VOCs (24-hr) and PM components • Annual performance evaluation
Data For Model Evaluation • 1-hr average concentrations for all 1998 • O3, NO, CO, NO2 • ARB and District monitoring sites • 24-hr Average concentrations for PM10 components • 24-hr measurements for selected VOCs
CMAQ/Models-3 August 1- 7, 1998 January 1-31, 1998 Performance evaluation CALGRID August 1-7, 1998 January 1-31, 1998 Performance evaluation Completed Simulations
C A L G R I D C A L G R I D Aug 3 @ 13 hrs Aug 2 @ 14 hrs Peak O3 CMAQ: AUG 3 at 16 hrs CMAQ: AUG 2 @ 17 hrs
24-hr Model PerformanceAugust 1-7, 1998 • Calculated 24-hr monthly average for O3, CO, and NOx (from hourly values) and compare with predictions • Insufficient data to fully assess 24-hr model performance for toxics
Ratio of Predicted-to-Observed 24-hr averages for Toxics on August 1-7, 1998
January 1998 Predicted Ozone Distribution During Peak CALGRID January 26, 1998 at 16 hrs CMAQ/Models-3 January 18 @ 14 hrs
24-hr Model PerformanceJanuary • Calculated 24-hr monthly average for O3, CO, and NOx (from hourly values) and compare with predictions • Insufficient data to fully assess 24-hr model performance for toxics
Ratio of Predicted-to-Observed 24-hr Averages for Toxics on January, 1998
SUMMARY • Prepared inputs for all 1998 for CALGRID and CMAQ/Models-3 • Simulated an extended period (January) and part of August with CALGRID and CMAQ/Models-3 • 24-hr average concentrations: On average both models show similar 24-hr performance (both January and August 1-7)
MATES IIMultiple Air Toxics Exposure Study II • South Coast Air Quality Management District • Monitored ~30 pollutants from April 1, 1998 to March 31, 1999 at 10 sites • Air quality modeling for entire MATES II period • UAM with CB-IV and UAM-tox with updated CB-IV • CALMET for meteorology • Domain • 105 x 60 cell (2x2 km2), 5 layers ; region top of 2 km
CRC & DOE/NREL Study • Final report dated June 30, 2000 • CAMx/RTRAC to treat reactive inert species • Simulated MATES II using CB-IV • MATES II Mobile source emissions EMFAC7G • MATES II Mobile source emissions update to reflect EMFAC2000 • Meteorological fields from CALMET • 10 MATES-II sites for model performance • August 3-7, 1997 (MM5, CB-IV and SAPRC-99)
Future Work • January, 2003: • CALGRID for entire year • Models-3/CMAQ for selected periods • Model performance evaluation • Annual averages and potential risks • Contour plots of risk by species and total risk • February, 2003: • Draft report