Download
1 / 8
80 likes | 272 Views
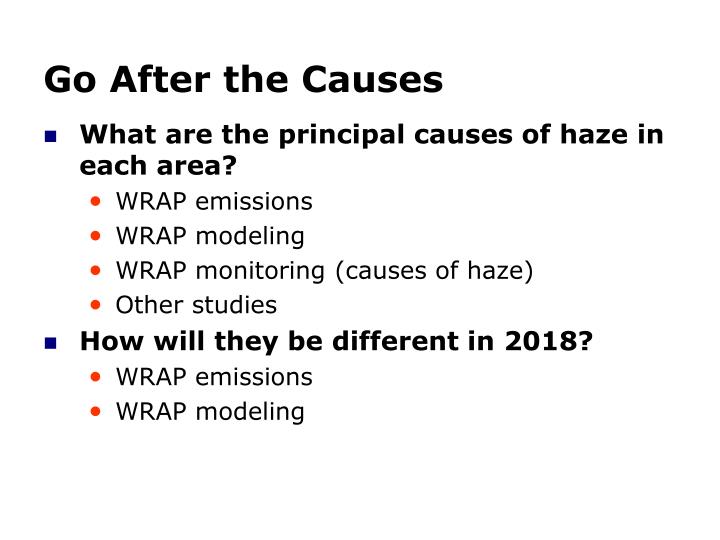
Go After the Causes. What are the principal causes of haze in each area? WRAP emissions WRAP modeling WRAP monitoring (causes of haze) Other studies How will they be different in 2018? WRAP emissions WRAP modeling. 23 Clusters Based on Elevation Adjusted Aerosol Chemical Speciation.

E N D
Go After the Causes • What are the principal causes of haze in each area? • WRAP emissions • WRAP modeling • WRAP monitoring (causes of haze) • Other studies • How will they be different in 2018? • WRAP emissions • WRAP modeling
23 Clusters Based on Elevation Adjusted Aerosol Chemical Speciation
Difference of Aerosol Chemical Speciation Between YOSE and HOOV for Q1 – Q4 During Quarter 1, Hoover has much more soil and coarse mass in aerosols than Yosemite National Park; while Yosemite National Park has more OC/EC and Nitrate throughout the year.
Carbon Dating at Yosemite • Lower bound on antrho • Upper bound on biomass burning • Data from abnormally high OC days
Guiding Light for Forums • Contribute to apportionment process • Provide emissions • Help interpret results • Recommend controls • Which ones, how much, where, and when • 309 implementation
Yosemite Field Study • Sponsored by NPS • Turtleback Dome • July 15 - September 4, 2002 • San Joaquin Valley had most bad air days since 1998 • OC on hazy days typically 45% of fine mass, but 80% during study • Large fires in sourthern OR and southern CA