Download
1 / 17
170 likes | 290 Views
Visual analytics for discovering entity relationship on text data. Hanbo Dai Ee-Peng Lim Hady Wirawan Lauw HweeHwa Pang. Analysis scenario. A homeland security analyst Finds out relationships between two terrorists on complex, large information sources Needs user judgments. Mas Selamat.

E N D
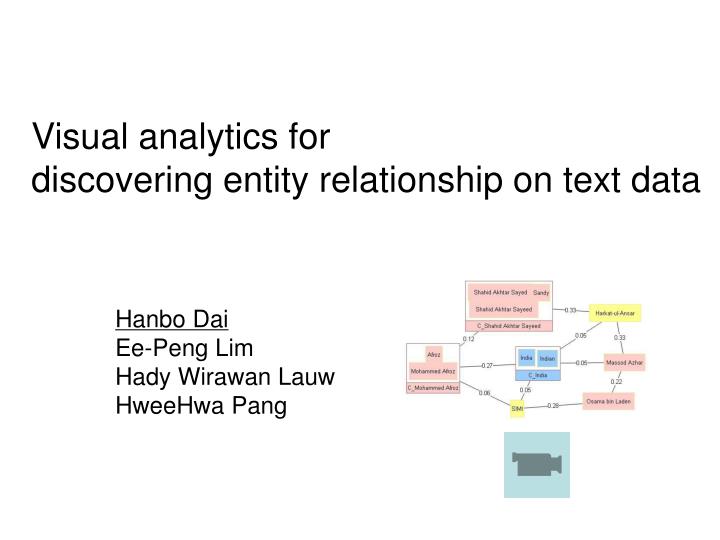
Visual analytics for discovering entity relationship on text data Hanbo Dai Ee-Peng Lim Hady Wirawan Lauw HweeHwa Pang
Analysis scenario • A homeland security analyst • Finds out relationships between two terrorists on complex, large information sources • Needs user judgments Mas Selamat Jemaah Islamiah Osama Bin Laden Al-Qaeda Born in Central Java Was not directly connected Justinus Andjarwirawan Abu Latif
Two TUBE (Text-Cube) instances for entity relationship discovery Document Evidencee.g. {d1, d2,…} Mask value (0/1)nodes Measures e.g. Path_strength e0 e1 e2 e3 e4 T1=<S1, B1, M1, D> e1 e0 e2 e3 e4 e0 Document Evidencee.g. {d3, d4,…} Mask value (0/1)edges Measures e.g. strength e1 T2 =<S2, B2, M2, D> e2 e3 e4
Visual analytical operations • Insert • Cluster • Delete
Conclusion • Interactive visual method to discover entity and relationships embedded in text data • ER-Explorer equipped with TUBE model and operations • Our tool assisted analysts in finding relationships between two terrorists
Case study • Dataset: The hijacking of IC814 • Entities of type Person, Organization, Event, GPE are extracted • Co-occurrence Relationships are identified on sentence level. • Each sentence is considered as a document.
Text-Cube Model Represents Entities and Relationships • An entity is either a named entity or a conceptual entity. • A n-dimensional TUBE is a tuple T= <S, B, M, D> • S: Schema = {s1, s2,…, sn} • Si denotes the list of entities of dimension i • B: Mask • 0 or 1 value • M: Measure= {m1, m2,…, m|M|} • Each measure mi is associated with a measure function mfi • D: Document Collection • A TUBE T has | s1|×|s2|×…×| sn | cells • A cell c • Has document evidence denoted as Fd(c) • Is present if B(c)=1 , or hidden if B(c)=0 • Has measure value denoted as c.mj , computed by mfj(c) • Represent the co-occurrence relationship, if Fd(c) is not empty
Two TUBE Instances for entity relationship discovery • A discovery task is to find interesting paths between two entities source (s) and target (t) • A path represents a chain of relationships • 1-Dimension TUBE instance: T1=<S1, B1, M1, D> • S1 initiated as all named entities • M1= {path_strength} • The strength of shortest path through an entity between s and t • 2-Dimension TUBE instance: T2=<S2, B2, M2, D> • S2 initiated as all named entities on both dimensions • M2= {name_sim, strength, dom_entity} • name_sim • Computed by edit distance • strength • Computed by Jaccard Coefficent or Dice Coefficent • dom_entity • Whenever ei appears ej is always there, ej dominate ei
Related Work • Social network visualization • assume entities and relations • have been identified and verified. • can be studied without supporting document • Use only measures of graph structure, such as degree, centrality. • Automatic path/subgraph finding algorithms • Users have little control over the relations and entities involved • Do not consider semantically identical entities.
Formal definition of entity • Entity e is defined as a named object or a set of other entities.
Tube operations • Insert • Add an entity to a dimension • Remove • Remove an existing entity from a dimension • SelectCell • Assign 0 or 1 to a entry (a cell in T) in Mask • Cluster • Add a new conceptual entity representing a subset of entities to a dimension
Visual Analytics Operations • Insert an entity • SelectCell in T1 and T2 • Reveals all relationships this entity has with all entities in the network • Delete • Delete a named entity • SelectCell in T1 • Delete a conceptual entity • Remove in T1 and T2 • Delete a relationship (a cell) • SelectCell in T2 • Cluseter • Cluster in in T1 and T2