Download
1 / 34
340 likes | 553 Views
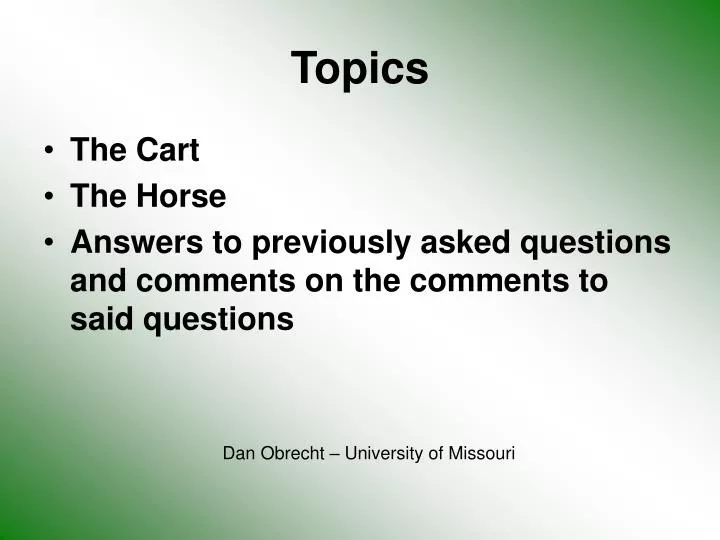
Topics. The Cart The Horse Answers to previously asked questions and comments on the comments to said questions. Dan Obrecht – University of Missouri . The Cart. Carlson’s TSI. =. Carlson’s Trophic State Index. TSI 20 30 40 50 60 70 80. Secchi (m) 16 8 4 2 1 0.5 0.25.

E N D
Topics • The Cart • The Horse • Answers to previously asked questions and comments on the comments to said questions Dan Obrecht – University of Missouri
The Cart Carlson’s TSI =
Carlson’s Trophic State Index TSI 20 30 40 50 60 70 80 Secchi (m) 16 8 4 2 1 0.5 0.25 CHL (ug/L) 0.34 0.94 2.60 6.40 20.0 56.0 154.0 TP (ug/L) 3 6 12 24 48 96 192
“My purpose here is to present a new approach to the trophic classification of lakes.” “It should be emphasized that the number generated is only an index of the trophic status of a lake and does not define the trophic status.”
The Current Ozark Criteria Advisory Action TSI value TSI value Oligotrophic 36 40 Mesotrophic 47 50 Eutrophic 60 65
The Current Ozark Criteria Advisory Action TP level TP level Oligotrophic 9.1 12.0 Mesotrophic 19.5 24.0 Eutrophic 48.1 68.0
Trophic Cut-Points based on Total Phosphorus from Nurnberg (1996) E-H 100 100 96 50 56 - 100 100 - 68 Comments and Reference World-wide Vollenweider (1968) World-wide Wetzel (1975) North America Carlson (1977 and per com) North America Reckhow and Chapra (1983) South Ontario Dillion and Rigler (1975) USA Porcella et al. (1980) MO Reservoir Jones and Knowlton (1993) Sweden Forsberg and Ryding (1980) Green Bay of Lake Michigan Auer et al. (1986) Current Ozark Criteria O-M 10 10 10 10 10 14 10 15 11.5 12 M-E 30 30 24 20 18/30 25 25 25 37.5 24
Number of Ozark Reservoirs in each Trophic Category TSI Cut-Points MO Reservoir Cut-Points Oligotrophic 13 10 Mesotrophic 18 23 Eutrophic 22 20 Includes all Ozark Reservoir.
Which criteria is the most appropriate?Which criteria is the easiest to incorporate into the rationale?
An oligotrophic reservoir is defined as having 12 micrograms per liter or less total phosphorus, which correlates to a Carlson Trophic State Index value of 40, as calculated using the following formula:TSI = 14.42 * ln(TP) + 4.15A TSI value of 40 is generally accepted as the cut-point between oligotrophic and mesotrophic classifications in systems where phosphorus is the nutrient limiting algal biomass and algal biomass is the dominant factor influencing water clarity. The TSI was developed using data from an assortment of lakes including Lake Superior and Crater Lake.
An oligotrophic reservoir is defined as having 10 micrograms per liter or less total phosphorus based on criteria developed for Missouri reservoirs with data from Missouri reservoirs.
Answer 3 or 4 samples during the summer does a fairly decent job of estimating the mean phosphorus level (± 15%). You would have to increase the sample size to ≥6 to improve precision to ± 10%. Extending monitoring beyond the summer would require a greater sampling effort.
Comments on Comments • Spatial variability on the horizontal axis • Spatial variability on the vertical axis • Sampling of outflow • TP
This question can be expanded into three different questions. 1) How will the criteria be generated? 2) How will the TP values that are compared to the criteria be generated? and 3) How will we compare the two numbers? • We are still figuring out how to generate the criteria. • Geometric mean of 4 summer samples. • I’m not sure, but we will have to take year-to-year variability into account when making the comparisons.
How will algal blooms be determined as excessive in relation to aquatic life?
Answer I don’t know. This is part of the problem with defining impairment – it is at best difficult to do.
Comment of Comments According to Downing et al. (2001) 10 ug/L chlorophyll is the point where the risk of having blue-green algae dominate the algal population starts to increase in natural lakes. If chlorophyll >10 ug/L it does not mean blue-green algae will be dominant, and it certainly does not mean that you will have taste and odor problems.
How to separate the influence of inorganic suspended solids from that of chlorophyll when Secchi transparency is the response variable?
Answer You can’t
Comment of Comments As pointed out in Tony’s response – diatoms are algae.
Answer We don’t have reference lakes, we have reservoirs.
Theory behind Reference Lakes • You have a lake that was once oligotrophic but isn’t anymore. • You sample a reference lake that hasn’t been impacted to see what water quality is like. • You try get water quality in impacted lake to resemble water quality in the un-impacted reference lake.
Why doesn’t it work in Missouri? • Most reservoirs were built into landscapes that had already been altered. • Most reservoirs have probably not seen a dramatic change in water quality – they were eutrophic when they were created. • Reservoirs were built knowing that they will “age” faster than natural lakes and have a life span that may not be more than 100 years.
Forest 9420 acres 67% 3% 12,400 acre/feet 0.4 times/year 23 ug/L Watershed area Forest land cover Ag land cover Volume Flushing Index Total Phosphorus
Grindstone* 13,400 acres 5% 55% 3,270 acre/ft 1.9 times/yr 147 ug/L *Dam completed in 1990 Forest 9420 acres 67% 3% 12,400 acre/ft 0.4 times/yr 23 ug/L Watershed area Forest land cover Ag land cover Volume Flushing Index Total Phosphorus