Download
1 / 10
100 likes | 146 Views
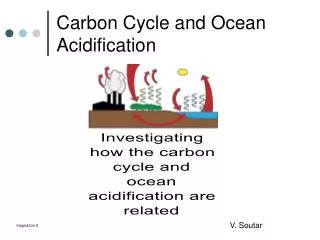
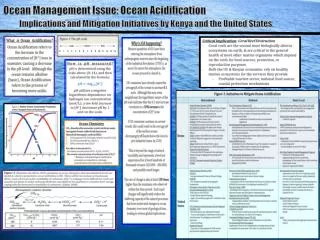
Ocean Acidification. EARTH New Hampshire 2007. What is the title of the graph? What is the X-axis? And units? The Y-axis? And units? What are the scales for both axes? Do you understand what these scales mean? How many variables are being measured?

E N D
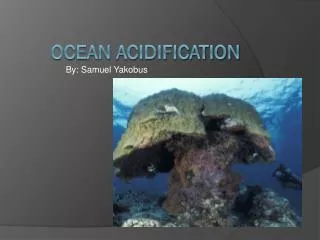
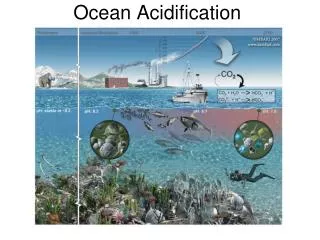
Ocean Acidification EARTH New Hampshire 2007
What is the title of the graph? • What is the X-axis? And units? • The Y-axis? And units? • What are the scales for both axes? Do you understand what these scales mean? • How many variables are being measured? • What relationship does the graph show? Answer this in more than one sentence. • What questions do you have after looking at this graph? • What kind of data would you need to access to collaborate your thoughts? • Which seems to be more stable.. the CO2 in the atmosphere or in the surface waters? Why do you think this could be ? • Why do you think this data might be valuable to someone studying climate change and it’s effects on the ocean?
PART IIEffect of Increased CO2 in the ocean on pH Come up with own lab to demonstrate the trend
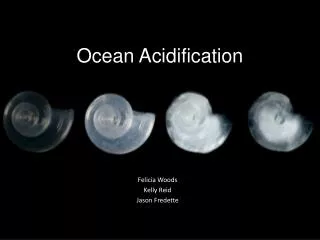
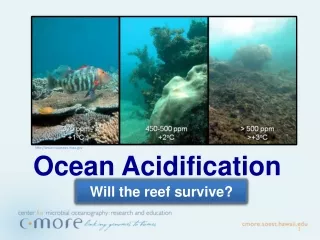
PART III EFFECT OF LOWERED pH on Ocean organisms Coccolithophores, pterods, forminferans, sea urchins, larval sea stars, deep sea corals, oysters and clams
Borrowed from http://www.affashop.gov.au/PdfFiles/brs_seminar_8jul05.pdf