Download
1 / 72
720 likes | 741 Views
Formulating and Evaluating Measures for Flood Risk Management Econ Analysis PROSPECT. Expanding the Approach to Planning. Corps’ Strategic Plan • A holistic focus on water problems and opportunities. • Attention to the watershed • A systems approach

E N D
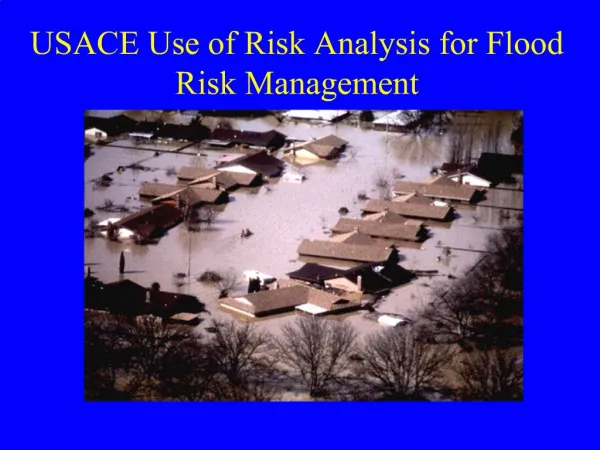
Formulating and Evaluating Measures for Flood Risk Management Econ Analysis PROSPECT
Expanding the Approach to Planning • Corps’ Strategic Plan • A holistic focus on water problems and opportunities. • Attention to the watershed • A systems approach • Collaboration, partnerships, and teamwork • An emphasis on efficiencies • 12 Actions for Change • Integrated, comprehensive, systems-based • Risk-based concepts, communication • EC 1105-2-404 • Planning under the Environmental Operating Principles
Goal: Maximize National Economic Development Benefitsconsistent with protecting the environment (i.e., maximize net excess benefits, benefits minus costs) Determines the extent of Federal investment Justification: The basis for damage reduction benefits is the comparison of the Without Project Condition(existing condition)against the With Project Condition(project in place)at some point in time or over a period of time (e.g., 50 years).
Guidance For Flood Risk Management Benefit Evaluation • Traditional methodology applies to both structural and nonstructural • Specific methodology for nonstructural
Guidance For Flood Risk Management Benefit Evaluation--traditional methodology • ER 1105-2-100, Appendix E, 31 Mar 2005 • IWR Report 88-R-2, National Economic Development Procedures Manual, Urban Flood Damage ER 1105-2-101, 1 March 1996 • ER 1105-2-101, 1 March 1996 (R&U)
Guidance For Flood Risk Management Benefit Evaluation -- specific methodology • Implementation Guidance for Section 219, Water Resources Development Act of 1999, Nonstructural Flood Control Projects Important to the evaluation of Evacuations and Relocations
Data Requirements for Economic Analysis With which to develop without project condition -- average annual equivalent damages under without project, base condition for a given interest rate and price level.
Data Requirements for Economic Analysis • Data requirements required for analysis: • Structure Inventory • Depth-damage Relationship • H&H Water Surface Profiles • For near term and “most likely” future conditions • 8 flood frequencies for input into HEC-FDA • Risk and Uncertainty parameters
Data Requirements for Economic Analysis (Continued) • Integration tool HEC-FDA with Risk and Uncertainty • Express uncertainty in: • Depth-damage Curves • Structure Values • Content Values • First-floor Elevation • Structure Types • Flood Warning Times • Flood Evacuation Effectiveness
Data Requirements for Economic Analysis Develop Structure Inventory 5 data elements for each structure • type -- match with depth-percent damage curves • value--replacement value less depreciation • location--with reference to river/stream stationing X and Y coordinates • ground elevation--derive from TIN, contour maps Z coordinate • first floor correction/threshold of flooding -- critical to damage estimation
Example of Tax Appraisal District Property Record as Attribute File
Develop Structure Inventory Without Project Damages Computation Hypothetical Example--data elements • Type One-Story Residential, No Basement • Value $75,000 replacement cost less depreciation • Exterior Brick Veneer, Square Feet = 2,500 • Location Greens Bayou Cross Section 167017 • Ground elevation 84.5 feet msl • First floor elevation 86.5 feet msl
Depth-Damage Relationship EGM 01-03, Generic Depth-Damage Relationship • percent damage to structure and contents based on value of structure by increment of flood stage/elevation • includes uncertainty in estimation
$80 $70 $60 $50 DOLLAR DAMAGES IN THOUSANDS $40 $30 $20 $10 $0 1 2 3 4 5 6 7 8 9 10 11 12 13 14 15 16 17 18 19 DEPTH OF FLOODING RELATIVE TO FIRST FLOOR ELEVATION LOWER LIMIT-STRUCTURE DAMAGE UPPER LIMIT-STRUCTURE DAMAGE LOWER LIMIT-CONTENT DAMAGE UPPER LIMIT-CONTENT DAMAGE As per EGM 01-03 Depth-percent Damage Curves with Uncertainty Residential, One-story, No Basement, $75,000 Value
DEPTH MEAN DEPTH MEAN DEPTH OF FLOOD STRUCTURE DAMAGE CONTENT DAMAGE FLOODING STAGE DAMAGE CURVE DAMAGE CURVE -2 84.5 0.000 $0.00 0.000 $0.00 -1 85.5 0.025 $1.88 0.024 $1.80 0 86.5 0.134 $10.05 0.081 $6.08 1 87.5 0.233 $17.48 0.133 $9.98 2 88.5 0.321 $24.08 0.179 $13.43 3 89.5 0.401 $30.08 0.220 $16.50 4 90.5 0.471 $35.33 0.257 $19.28 5 91.5 0.532 $39.90 0.288 $21.60 6 92.5 0.586 $43.95 0.315 $23.63 7 93.5 0.632 $47.40 0.338 $25.35 8 94.5 0.672 $50.40 0.357 $26.78 9 95.5 0.705 $52.88 0.372 $27.90 10 96.5 0.732 $54.90 0.384 $28.80 11 97.5 0.754 $56.55 0.392 $29.40 12 98.5 0.772 $57.90 0.397 $29.78 13 99.5 0.785 $58.88 0.400 $30.00 14 100.5 0.795 $59.63 0.400 $30.00 15 101.5 0.802 $60.15 0.400 $30.00 16 102.5 0.807 $60.53 0.400 $30.00 Without Project Depth-Percent Damages (One-story, No Basement Residential Valued at $75,000)
ANNUAL TOTAL FLOOD PROBABILITY FLOOD STRUCTURE CONTENT FLOOD EVENT OF STAGE FLOOD FLOOD DAMAGES OCCURRENCE DAMAGES DAMAGES $0.00 2 0.5 83.13 $0.00 $0.00 $14.01 5 0.2 86.33 $8.66 $5.35 $29.18 10 0.1 87.64 $18.40 $10.78 $40.13 25 0.04 88.79 $25.82 $14.32 $45.58 50 0.02 89.39 $29.42 $16.16 $48.74 100 0.01 89.77 $31.49 $17.25 $53.00 250 0.004 90.30 $34.28 $18.72 $54.52 500 0.002 90.49 $35.27 $19.25 Near-Term Without Project Frequency-Damage (One-story, No Basement Residential Valued at $75,000) No uncertainty presented
FREQUENCY ELEVATION DISCHARGE DISCHARGE FREQUENCY ELEVATION EXPECTED ANNUAL FLOOD LOSS DAMAGE DAMAGE Integration Technique Graphically Displayed
ANNUAL DAMAGE OCCURRENCE PROB. OF ANNUAL INTERVAL INTERVAL FREQUENCY DAMAGES OCCURRENCE DAMAGES SPF 500 0 $54.52 $54.52 0.002 $0.11 SPF 500 0.002 $54.52 $53.76 0.008 $0.43 250-YR 250 0.004 $53.00 $52.09 0.006 $0.31 $47.16 0.01 $0.47 100-YR 100 0.01 $48.74 50-YR 50 0.02 $45.58 $42.85 0.02 $0.86 25-YR 25 0.04 $40.13 $34.66 0.06 $2.08 $21.59 0.1 $2.16 10-YR 10 0.1 $29.18 $7.00 0.3 $2.10 5-YR 5 0.2 $14.01 2-YR 2 0.5 $0.00 $0.00 0.5 $0.00 1-YR 1 1 $0.00 EXPECTED ANNUAL $8.51 DAMAGES PWE, EAD'S $127.37 @.06375 Frequency Damages Annualized as Expected Annual Damages
What Can We Afford to Do? • Are damages of sufficient magnitude to warrant Federal action? • Are there sufficient number of properties to cover fixed cost of possible remedy? (applies to nonstructural) Goal of NED analysis: • Establish Federal Interest with a positive Benefit-Cost Ratio • Optimize Plan by Maximizing Net Excess Benefits--money spent most economically efficiently
Structural measures Modify flood behavior, change flood profile Dams and reservoirs, levees, walls, diversion channels, bridge modifications, channel alterations, pumping, and land treatment Nonstructural measures Modify damage susceptibility Flood warning and preparedness; Evacuation and relocation; Land use regulations; Flood proofing; Area renewal policies Flood Risk Management Measures 25 March 2008
Primary Difference in Implementation of Nonstructural Measures Affect Change to Privately-Owned Land
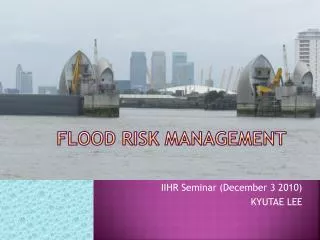
Evaluationof Without Project Condition 27 March 2008
Channel Modification 28 March 2008
Levee 29 March 2008
Nonstructural Measures Change to stage-damage curve only • Elevation: elevate structure on fill/beams/etc. Raising-in place, raising to target • Flood Proofing, Dry: seal/waterproof • Floodwalls and Berms • Flood Proofing, Wet: flood proof first floor, elevate contents • Floodwarning • Relocation/Buyout/Acquisition
Which Measures Apply? • Damage profile, distribution of damages • Activities in watershed/floodplain: upstream, downstream, existing and projected land use • Environmental concerns • Non-Federal sponsor’s preference?
Economic Benefit Calculation • Where are the Bennies? • Which categories are appropriate for each measure?
Benefit Categories for Structural Measures • Inundation Reduction • Reduction in FIA Overhead • Location • Flood Proofing Costs Reduced • Intensification • Restoration of Land Values
New activity moves into the protected floodplain Benefits calculated as whichever is less of: Increased potential damages in the changed land use assuming without project conditions; or Cost of fill/flood proofing LocationBenefits 34 March 2008
Intensification Benefits Existing activity is intensified Benefits calculated as: Increased income as a result of intensified activity Increased land values Computation of costs and revenues 35 March 2008
BENEFITS TO NONSTRUCTURAL MEASURES • Inundation Reduction • Reduction in FIA Overhead • Value of New Use of Floodplain for Relocations/Buyouts
Berms and Floodwalls Dry Flood Proofing Elevation Claimable Benefits • Reduction in primary flood damages to structures and contents
Floodwarning Run away! Run away! Claimable Benefits • Reduction in primary flood damages to contents • Reduction in damages to vehicles
Relocation Relocation: Floodplain Evacuation/Buyout Claimable Benefits • Reduction in primary flood damages to structures and contents • Reduction in FIA overhead • Value of new use of vacated land • Recreation benefits • Reduction in damage to public property, utilities, roads • Reduction in post-emergency evacuation/cleanup costs
Elevation Elevation: Elevate structure on fill/beams/etc. Raising-in-Place, Raising to Target
Raising-in-Place Structure Flood Proofed by Abandoning First Floor and Moving Living Quarters to Upper Levels
90% 80% 70% 60% 50% PERCENT DAMAGE 40% 30% 20% 10% 0% 84.5 85.5 86.5 87.5 88.5 89.5 90.5 91.5 92.5 93.5 94.5 95.5 96.5 97.5 98.5 99.5 100.5 101.5 102.5 FLOOD STAGE WITHOUT PROJECT RAISE 2 FEET RAISE 3 FEET RAISE 8 FEET Stage-Percent Damage Curve (Comparison of Raising a 1-story, No Basement Residential Structure)
PWE AAEV NET EXCESS DAMAGES DAMAGES PWE PWE NET EXCESS BENEFITS REDUCED BENEFITS BENEFITS COSTS EXISTING $8.51 RAISE 2 FT $2.34 $6.17 $92.41 $79.43 $12.98 $0.87 RAISE 3 FT $0.23 $8.28 $123.98 $82.69 $41.29 $2.76 RAISE 8 FT $0.00 $8.51 $127.37 $96.39 $30.98 $2.07 Hypothetical Example Evaluate and Optimize Raising Residential Structure
$3 $2.76 $3 $2.07 $2 THOUSANDS NET EXCESS BENEFTIS IN $2 $1 $0.87 $1 $0 RAISE 2 FT RAISE 3 FT RAISE 8 FT PLANS FOR RAISING Optimization of Raising-in-Place Net Excess Average Annual Equivalent Benefits Comparison-- Raising in Place
Dry Flood Proofing Dry Flood Proofing: Seal/Waterproof
90% 80% 70% 60% 50% PERCENT DAMAGE 40% 30% 20% 10% 0% 101 102 103 84.5 85.5 86.5 87.5 88.5 89.5 90.5 91.5 92.5 93.5 94.5 95.5 96.5 97.5 98.5 99.5 FLOOD STAGE 2 FT PROTECTION WITHOUT PROTECTION 4 FT PROTECTION 3 FT PROTECTION Dry Flood Proofing : seal/waterproof and Levees, Floodwall, and Berms Comparison of Stage-damage for Flood Proofing a 1-story, No Basement, Residential Structure
PWE AAEV DAMAGES DAMAGES PWE PWE NET EXCESS NET EXCESS REDUCED BENEFITS COSTS BENEFITS BENEFITS EXISTING $8.51 2 FT PROTECTION $1.71 $6.80 $101.76 $11.20 $90.56 $6.05 3 FT PROTECTION $0.50 $8.00 $119.82 $16.40 $103.42 $6.91 4 FT PROTECTION $0.00 $8.51 $127.37 $26.70 $100.67 $6.72 Dollars X 1,000 Dry Flood Proofing : Seal/waterproof also Levees, Floodwalls, and Berms Optimization of Protection Height
$7.00 $6.91 $6.80 $6.72 $6.60 NET EXCESS BENEFTIS IN $6.40 THOUSANDS $6.20 $6.05 $6.00 $5.80 $5.60 2 FT 3 FT 4 FT PROTECTION PROTECTION PROTECTION PLANS FOR PROTECTION Optimization of Protection Height Net Excess Average Annual Equivalent Benefit Comparison -- Floodwall Height
Wet Flood Proofing Wet Flood Proofing: Flood Proof first floor, Elevate contents
$60 $50 $40 DAMAGES IN THOUSANDS $30 $20 $10 $0 0.5 0.2 0.1 0.04 0.02 0.01 0.004 0.002 EXCEEDANCE PROBABILITY WITHOUT PROJECT RAISE CONTENTS Wet Flood Proofing: Hypothetical - Change to Content Damages Only Damage Frequency Curve For One-story, No Basement Residential Structure $75,000 Value