Download
1 / 25
250 likes | 267 Views
Explore a CGE approach to estimate direct and indirect economic costs of water quality improvements for policy analysis. This presentation provides insights from the International Workshop on Water Accounting for Integrated Water Resource Management.

E N D
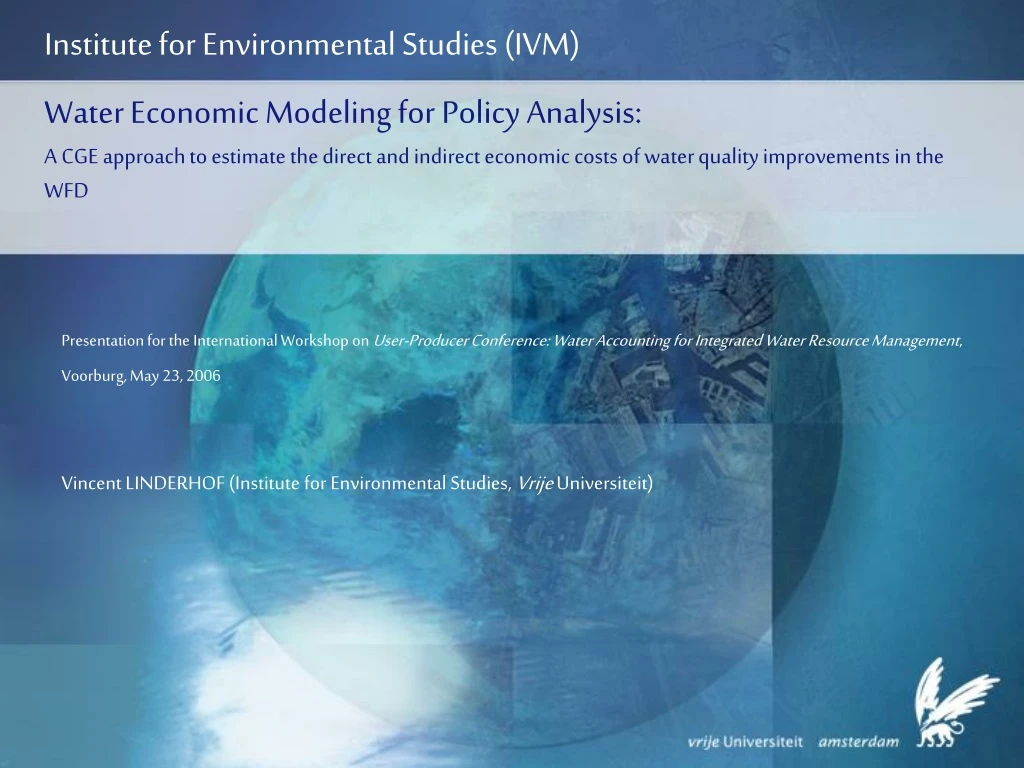
Institute for Environmental Studies (IVM) Water Economic Modeling for Policy Analysis:A CGE approach to estimate the direct and indirect economic costs of water quality improvements in the WFD Presentation for the International Workshop on User-Producer Conference: Water Accounting for Integrated Water Resource Management, Voorburg, May 23, 2006 Vincent LINDERHOF (Institute for Environmental Studies, Vrije Universiteit)
Outline • Introduction WEMPA • AGE Model • Economy • Environment • Linkage • Data • Results (preliminary) • Potential and issues of the model
Introduction WEMPA • The ‘Directorate-General Water’ of the Ministry of Transport, Public Works and Water Management would like to have insight in direct and indirect economic costs of WFD measures. • Donors: • ‘Directorate-General Water’ and • Leven met Water (Living with water) • Participating organizations: • Institute for Environmental Studies (IVM), Vrije Universiteit • Agricultural Economic Research Institute (LEI) • Statistics Netherlands (CBS) • RIZA • WL Hydraulics
WEMPA Approach Modular approach Top-down modeling starting with economic model
WEMPA Approach Modular approach Top-down modeling starting with economic model Use of existing knowledge • Models (AGE-SNI, DEAN from IVM, Substance flow model from RIZA/WL) • Data (NAMWA and National Accounts from CBS, abatement technologies from experts)
Model • Integrated assessment model of IVM including the economy and physical flows. • Static Applied General Equilibrium (AGE) Model for the Dutch economy • Measures instant costs and losses in Net National Income • No technological changes over time • Objective: maximization of Net National Income subjected to environmental constraints
Model: economy • Static AGE model with 27 production sectors (38 or even 58) • Production structure: nested Constant Elasticity of Transformation/Substitution (CET/CES)
Model: economy • Static AGE model with 27 production sectors • Production structure: nested Constant Elasticity of Transformation/Substitution (CET/CES) • Three consumers: private households (luxury and subsistent consumption), government, the Rest of the World • Consumption structure: price and income elasticities given
Model: economy • Environmental sectors • Abatement sector: demand and supply of abatement technologies • Emissions and abatement enter production functions as inputs • Emission permits: demand and supply of emission permits given the total amount of emission permits based on the emission norms
Model: environment • NAMWA data from Statistic Netherlands • Two physical flows (environmental themes) • Eutrophication (NAMWA) • 10 kg N = 1 kg P = 1 Phosphor eq. • Dispersion of toxic substances to water (NAMWA) • 1 Aquatic Eco-Toxicity Potentials (aetp equivalents) equals • 6.3 kg Arsenic • 217.4 kg Chromium • 3.4 kg Cadmium • 3.2 kg Cupper • 3.6 kg Mercury • 0.3 kg Nickel • 666.7 kg Lead • 55.6 kg Zink
Model: environment • Input in model (NAMWA) • Emission intensity (per sector); • Abatement technologies (costs and reduction potential from experts); • Emission standards (will be derived from water quality standards)
Model: environment • Input in model (NAMWA) • Emission intensity (per sector); • Abatement technologies (costs and reduction potential from experts); • List of measures off which some are policy scenario based • Emission standards (will be derived from water quality standards) • All environmental themes are equal to or are less than the emission norm imposed • Interactions between environmental themes
Model: environment • Trade-off for meeting emission standards: • Investment in abatement technologies or • Costs of emission permits • If marginal costs > Marginal investment, then reduce economic activities and consequently reduce emissions Remark 1: if economic volume declines, the reduction potential of abatement technologies declines as well! Remark 2: high intensity sectors are likely to invest first, but this depends largely on the economic structure • Emission permits scheme • Amount of permits are determined by the emission norms • Revenues are recycled into the economy
Results (1) • Three scenarios: 10%, 20% and 50% reduction of emissions: the exact emission norms derived from WFD are yet unknown • Two variants • Variant I: No changes in relative world market prices • Variant II: Changes in relative world market prices • Results are very preliminary
Results (4) direct vs. indirect costs (preliminary) • “Direct costs” = Investments in abatement technologies • “Indirect costs” = Loss in Net National Income minus investments
Example of the distribution of direct and indirect costs across river basins for a 50% emission reduction scenario Rhine-West 51% Rhine-Centre 8% Rhine-East 11% Rhine-North 5% Scheldt 2% Meuse 20% Ems 3% Results (5) Regional impact (NAMWARiB)
Future improvements • Dynamic model (DEAN) • Substances instead of environmental themes • Sector-specific but generic abatement technologies • Regional distinctions but production sectors (growth expectations) • Extension of priority substances, such as POP’s, PCB’s and dioxines • No physical water flows
Thank you! • More information on our project Water economic mosdeling for Policy Analysis (WEMPA): • http://www.ivm.falw.vu.nl/watereconomics • Thank you!