Download

1 / 18
190 likes | 459 Views
Learn how to determine the impact of risk factors on disease occurrence using attributable risk calculations. Understand the measures and proportions involved to assess the significance of risk factors.

E N D
Principles of Epidemiology for Public Health (EPID600) Module appendix - Attributable risk Victor J. Schoenbach,PhD home page Department of EpidemiologyGillings School of Global Public HealthUniversity of North Carolina at Chapel Hill www.unc.edu/epid600/ Attributable risk
Attributable risk - conceptual Assume that we know that a factor causes a disease. How can we answer the “so what?” questions: • “How much risk is attributable to that factor?” • “How many cases are attributable to that factor?” The answers depend on: (1) by how much the factor increases risk and (2) how common the risk factor is. A strong risk factor that is common has a large impact. Attributable risk
Background risk – 8 cases / 200 people(1/25 = 4%) O O O O O O O O Attributable risk
Risk in exposed vs. unexposed (4/75 = 5.3%) vs. (5/125 = 4%) O O O O O O O O O Attributable risk
Attributable risk – proportion of risk in exposed population (PAR) O O O O O O O O O Attributable risk
Attributable risk – proportion of risk in the entire population (PARP) O O O O O O O O O Attributable risk
Attributable risk – counterfactual comparison O O O O O O O O O Attributable risk
Attributable risk measures Attributable risk
Attributable risk – substitute population required 4 cases in 75 exposed persons, risk = 5.33% 5 cases in 125 unexposed persons, risk = 4.00% 9 cases in 200 persons (total), risk = 4.50% Attributable risk
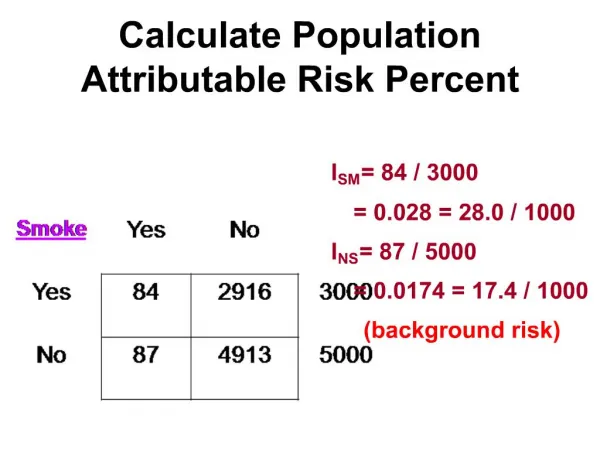
Attributable risk calculations 4 cases in 75 exposed persons, risk = 5.33% 5 cases in 125 unexposed persons, risk = 4.00% 9 cases in 200 persons (total), risk = 4.50% Attributable risk = 5.33% − 4.00% = 1.33% (risk difference) Population attributable risk (PAR) = 4.50% − 4.00% = 0.50% Attributable risk proportion (ARP) = 1.33% / 5.33% = 25% (attributable cases / exposed cases = 1/4 = 25%) Population attributable risk proportion (PARP) = 0.50% / 4.50% = 11% (attributable cases / all cases = 1/9 = 11%) Attributable risk
Attributable risk – assumption, perspectives We are assuming that the exposure is a cause of the disease. The “attributable risk” for an exposure is the risk that would not have occurred without the exposure. Can use either of two perspectives: 1. difference in risk between exposed and unexposed people 2. difference in risk between total population and unexposed people Attributable risk
Attributable risk – relative or absolute Attributable risk can be presented as: 1. an “absolute” number, e.g., “80,000, or 20 per 100 cases/year of stroke are attributable to smoking” 2. a “relative” number, e.g., “20% of stroke cases are attributable to smoking”. (analogy: a wage increase in a part-time job: $ increase, % increase in wage, % increase in income) Attributable risk
How much risk is attributable: absolute perspective Incidence proportion (risk) People Attributable risk
How many cases are attributable? (absolute) Incidence proportion (risk) How many cases are expected without the exposure? (2.5% x 3,000 = 75) 50 25 People Attributable risk
Absolute perspective: amount of caseload Incidence proportion (risk) How many cases are attributable? (150 – 75 = 75) 75 25 50 People Attributable risk
For relative measures, think of % of cases Cases Attributable risk
Relative perspective: % of caseload Incidence proportion (risk) Express attributable cases as a % of all exposed cases “Attributable risk proportion or %” 75% People Attributable risk
Relative perspective: % of caseload Incidence proportion (risk) Express attributable cases as a % of all cases “Population attributable risk proportion or %” 50% Attributable risk