Download
1 / 58
580 likes | 601 Views
Correlation. Two variables: Which test?. X. Contingency analysis. Logistic regression. Y. Correlation Regression. t-test. Two variables: Which test?. X. Contingency analysis. Logistic regression. Y. Correlation Regression. t-test. Relationship Between Two Numerical Variables.

E N D
Two variables: Which test? X Contingency analysis Logistic regression Y Correlation Regression t-test
Two variables: Which test? X Contingency analysis Logistic regression Y Correlation Regression t-test
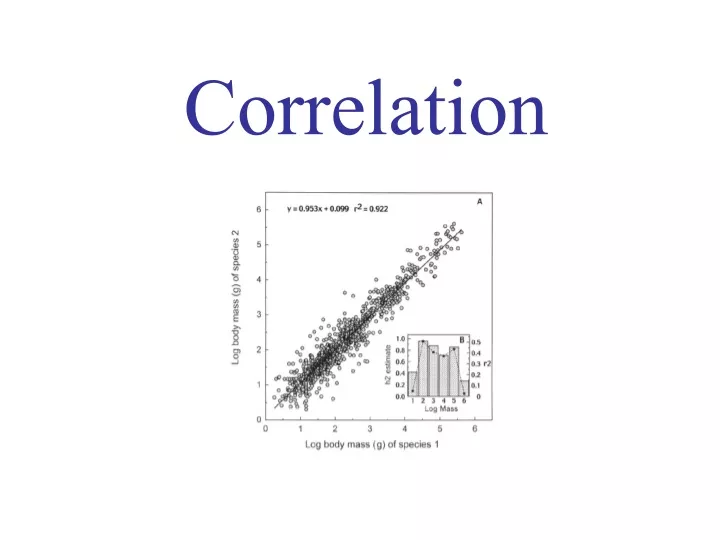
Correlation • What is the tendency of two numerical variables to co-vary (change together)?
Correlation • What is the tendency of two numerical variables to co-vary (change together)? • Correlation coefficient r measures the strength and direction of the linear association between two numerical variables
Correlation • What is the tendency of two numerical variables to co-vary (change together)? • Correlation coefficient r measures the strength and direction of the linear association between two numerical variables • Population parameter: r (rho) • Sample estimate: r
Sum of products Sum of squares: X and Y
r r r r
Correlation assumes... • Random sample • X is normally distributed with equal variance for all values of Y • Y is normally distributed with equal variance for all values of X
Correlation assumes... • Random sample • X is normally distributed with equal variance for all values of Y • Y is normally distributed with equal variance for all values of X Bivariate normal distribution
Correlation coefficient facts • -1 < r < 1; -1 < r < 1
Correlation coefficient facts • -1 < r < 1; -1 < r < 1 • Positive r: variables increase together • Negative r: when one variable increases, the other decreases, and vice-versa
Correlation coefficient facts • -1 < r < 1; -1 < r < 1 • Positive r: variables increase together • Negative r: when one variable increases, the other decreases, and vice-versa negative uncorrelated positive r=0 r = -1 r = 1
Correlation coefficient facts • Coefficient of determination = r2 • Describes the proportion of variation in one variable that can be predicted from the other
Example • Are the effects of new mutations on mating success and productivity correlated? • Data from Drosophila melanogaster • n = 31 individuals
X is productivity, Y is the mating success • Sum of products = 2.796 • Sum of squares for X = 16.245 • Sum of squares for Y = 1.6289
Example: Why Sleep? • 10 experimental subjects • Measured increase in “slow-wave” activity during sleep • Measured improvement in task after sleep - hand-eye coordination activity
Why sleep? • Sum of products: 1127.4 • Sum of squares X: 2052.4 • Sum of squares Y: 830.9 • Calculate a 95% C.I. for
Hypothesis Testing for Correlations • Can test hypotheses relating to correlations among variables • Closely related to regression - the topic for next Tuesday’s lecture
Hypothesis Testing for Correlations H0: r = 0 HA: r 0
If r = 0,... r is normally distributed with mean 0 with df = n -2
Example • Are the effects of new mutations on mating success and productivity correlated? • Data from Drosophila melanogaster
Hypotheses H0: Mating success and productivity are not related (r = 0) HA: Mating success and productivity are correlated (r 0)
X is productivity, Y is the mating success • Sum of products = 2.796 • Sum of squares for X = 16.245 • Sum of squares for Y = 1.6289
Why sleep? • Sum of products: 1127.4 • Sum of squares X: 2052.4 • Sum of squares Y: 830.9 • Test for a correlation different from zero in these data.
Checking Assumptions for Correlation • Bivariate normal distribution • Relationship is linear (straight line) • Cloud of points in scatter plot is circular or elliptical • Frequency distributions of X and Y are normal