Download
1 / 28
300 likes | 512 Views
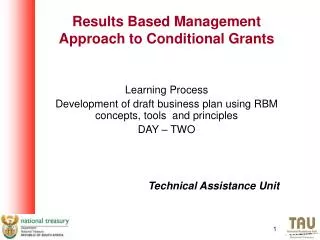
Results Based Management Approach to Business Planning Presentation to the Department of Health Forensic Pathology 12 July 2007 Peter Brook – Technical Assistance Unit. The linkage between; Results Based Management, and Conditional Grant Business Plan Framework. Topic of Presentation.

E N D
Results Based Management Approach to Business Planning Presentation to the Department of Health Forensic Pathology 12 July 2007 Peter Brook – Technical Assistance Unit
The linkage between; Results Based Management, and Conditional Grant Business Plan Framework. Topic of Presentation
Conditional Grant Cycle Level 1 Approval: CG approved for coming yr Grant Initiation Grant Formulation & Approval Implementa-tion Planning Implementation, Monitoring & Reporting Year 1 Prepare Business Plan for 2nd Year Implementation, Monitoring & Reporting Year 2 Forensic Pathology are currently here Prepare Business Plan for 3rd Year
How does the cumulative impact of long term initiatives get measured and reported? What is the contribution of the work being done in terms of the strategic goal? How can progress be measured and reported? Who needs to get such reports? Is government getting value for its money? How can interdependencies be managed? Can a shared understanding of service delivery be generated? Some Key Questions
Results Based Management assists in setting the stage to answer these and other questions Key elements include; The building in of a useful approach from the beginning of the strategic process; A focus on the results to be achieved; and Ongoing and continuous management over time and up and down the public sector hierarchy. RBM Elements & Solutions
Who is reached Input Activity Output Outcome What we use to do the work What outcomes & impact we wish to achieve. What has changed? What we do What we produce Who Benefits Project Framework Typical Focus RBM Focus
Activities vs. Outputs vs. Outcomes In summary, every Program undertakes Activities that produce Outputsthat contribute to the achievement of Outcomes.
Conduct research Publish documents Provide advice Contract for services Respond to enquiries Draft the business plan Organize Committee meetings Organize Committee travel Note that Activities contain verbs Examples of Activities Activities “what we do” Describes a collection of functions (actions, jobs, tasks) that consume inputs/resources and whose outputs deliver benefits/impacts to a client.
Research papers Advice and direction Service providers obtained and work initiated Business plan Committee reports Note that Outputs contain nouns Examples of Outputs Outputs“what we produce” The direct products and services generated through processes or activities without specific reference to their ultimate purpose.
Examples of Outcomes Outcomes“why we do it” The effects, benefits or consequences (impacts) that occur (either in the short, intermediate, or long-term) due to the outputs of programs, processes or activities. • A secure work environment • Electronic accessibility and equality • Sound management practices (accountability and reporting framework, people management, internal communications, technology support) • Representative workforce • Note that Outcomes refer to a changed state of beingandare stated in the present tense.
Indicators ( The “How”) A quantitative or qualitative attribute, statistic or parameter that, tracked over time, provides information on the condition of a phenomenon. (e.g. percentage of clients that are satisfied). Standards/Targets (The “How Much”) Specific quantitative or qualitative goals associated with specific performance indicators (e.g. 90% client satisfaction). Standards imply product and service levels to which an organization is prepared to commit. Targets imply a desired goal that may be more ambitious than a standard. Indicators, Standards/Targets In summary, Indicators, Standards and Targets are used to provide information on how efficiently and effectively the Program is being managed.
Examples of Indicators Indicators“the how” A quantitative or qualitative attribute, statistic or parameter that, tracked over time, provides information on the condition of a phenomenon • Cost per unit published • % of total workforce leaving the organization • Time (hours) to respond to a request for service • Level of satisfaction of service users/ providers
60% of South Africans are aware of housing subsidies opportunities Training cost per new employee is $2,000 85% of workforce is satisfied with working conditions, quality of life 99% availability of IT networks Examples of Standards/Targets Standards/Targets (the “How Much”) Specific quantitative or qualitative goals against which actualoutputs or outcomes will be compared
IDENTIFYING INPUTS, ACTIVITIES, OUTPUTS, OUTCOMES, INDICATORS, STANDARDS, TARGETS AND IMPACTS In groups of 2 or 3 examine the list below and reach consensus on which items are: INPUTS, ACTIVITIES, OUTPUTS, OUTCOMES, INDICATORS, IMPACT OR STANDARDS/TARGETS.
Results Chain RESULTS High Control Low Influence STRATEGIC OUTCOMES OUTCOMES (FINAL) OUTCOMES (INTERMEDIATE) INPUTS (RESOURCES) ACTIVITIES OUTPUTS OUTCOMES (IMMEDIATE) • A Results Chain can include multiple inputs, activities, outputs or outcomes. There are two types of Results: Outputs and Outcomes.
RBMManagement Framework Impact Manage/influence to achieve these Outcomes (change in behaviour) Outputs Project Manage & Budget for these Activities Inputs (deliverables)
RBMPerformance Framework Impact Indicator There need to be indicators of performance at all levels Outcomes Indicator Outputs Indicator Activities Indicator Inputs Indicator
Who is reached Input Activity Output Outcome What we use to do the work What outcomes & impact we wish to achieve. What we do What we produce Who Benefits Performance Measures Project Framework Typical Focus RBM Focus Indicators, baselines and targets
Goal(Impacts) Outcomes Outputs Activities Inputs Example - Working for Water Programme • Improved Ecological Integrity of Natural System • Enhanced Water Security • Productive Potential of Land improved • Improved biodiversity; Poverty reduction, etc • 1.0m hectares IAPs cleared in 10 years • 32 000 jobs created annually • “10 000” training days • Planning IAPs clearing • Managing IAPs clearing • Conducting research • Etc, etc, etc………. • R5bn, “70” staff members, etc
Example Goal – (Ultimate Impact) Community feels safe in the city centre and normal business and social activity returns to these areas Results Outcome Reduction of crime in the identified hot spots Output CCTV Crime monitoring system in city hot spot areas that records criminal activity and allows response units to be dispatched when criminal events are observed Activity Install CCTV system in crime hot spots with link to a control room and action response units Implementation Input Control room, control system, cameras, radio networks, funds, response units, monitoring staff
RMBLogical Framework Impact Assumptions Outcomes Assumptions Outputs Assumptions Assumptions hold true Activities THEN AND Inputs IF
Conditional Grant Cycle Outcomes must be stated for the entire programme in the initial business plan. Outputs are only required for the 1st year in the initial business plan. Outputs for each successive year are detailed in the Business Plan for that year Level 1 Approval: CG approved for coming yr Grant Initiation Grant Formulation & Approval Implementa-tion Planning Implementation, Monitoring & Reporting Year 1 Prepare Business Plan for 2nd Year Implementation, Monitoring & Reporting Year 2 Forensic Pathology are currently here Prepare Business Plan for 3rd Year
RBM goes beyond the work we do – it interrogates the impact this has. There is a hierarchical relationship between outputs and outcomes. Each level of this logic must and can be measured. Measurements used for management and reporting. Indicators are not the same up the hierarchy. Brief Summary