Download
1 / 22
220 likes | 382 Views
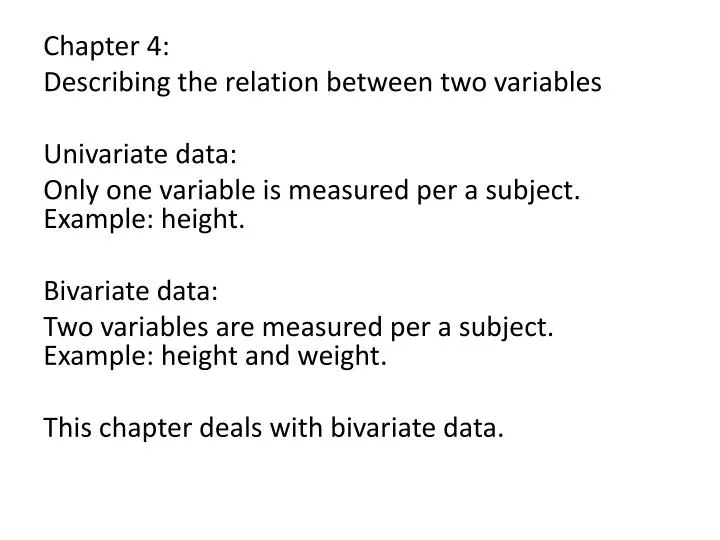
Chapter 4: Describing the relation between two variables Univariate data: Only one variable is measured per a subject. Example: height. Bivariate data: Two variables are measured per a subject. Example: height and weight. This chapter deals with bivariate data.

E N D
Chapter 4: Describing the relation between two variables Univariate data: Only one variable is measured per a subject. Example: height. Bivariate data: Two variables are measured per a subject. Example: height and weight. This chapter deals with bivariate data.
Section 4.1: Scatter diagrams and correlation • Scatter diagrams(plots) show the data. • Correlation is a statistic measuring linear relationship between x and y variables.
Quantitative bivariate data are usually displayed in a scatter plot (also called scatter diagram).
The “X” variable is called many names: • Explanatory variable • Predictor variable • Independent variable • Weeks of gestation is our x-variable here.
The “Y” variable is also called many names: • Response variable • Dependent variable • Outcome variable • Birth weight is our y-variable here.
When trying to determine which variable you should put on the x or y axes, think “cause and effect”. The “cause” variable should be on the x-axis. The “effect” variable should be on the y-axis.
Sample correlation coefficent (Also called “linear” or “Pearson product moment” correlation coefficient) -1 <= r <= 1
If the slope is negative, r<0. If positive slope, r>1 r=-1 or 1 means all points lie on straight line. Bottom row shows pattern, but it’s not linear.
Practice: n=? Mean(x)=? Mean(y)=? SD(x)=? SD(y)=?
Practice: n=? Mean(x)=? Mean(y)=? SD(x)=? SD(y)=? n=3 Mean(x)= 6, Mean(y)=3 SD(x) = 2, SD(y)=3 r=0.5
Correlation=? (A) 0 (B) 0.41 (C) 0.97 (D) 1