Download

1 / 10
100 likes | 171 Views
This lecture introduces resource allocation graphs, their reduction techniques, and methods for preventing deadlock. It covers detecting deadlock, setting resource limits, and computing the minimum resources required to prevent deadlock in a system with multiple processes and resource types.

E N D
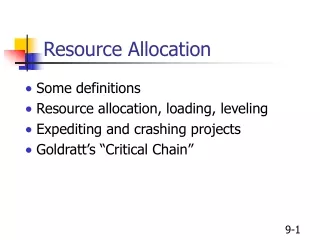
Lecture 4 Introduction to Resource Allocation Graphs
Resource-Allocation Graphs • Resource-allocation graphs • Squares • Represent processes • Large circles • Represent classes of identical resources • Small circles drawn inside large circles • Indicate separate identical resources of each class
Resource-AllocationGraphs Resource-allocation and request graphs.
Reduction of Resource-Allocation Graphs • Graph reductions • If a process’s resource requests may be granted, the graph may be reduced by that process • If a graph can be reduced by all its processes, there is no deadlock • If a graph cannot be reduced by all its processes, the irreducible processes constitute the set of deadlocked processes in the graph
Reduction of Resource-Allocation Graphs Graph reductions determining that no deadlock exists.
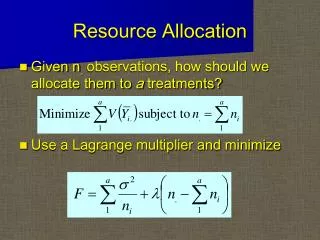
Resource Allocation Graphs and Deadlock Prevention We have learned that resource alloction graphs can be used to detect deadlock in a set of processes in contention for shared resources by simplifying the graph and then searching for irreducible cycles. In this exercise we will investigate a procedure for preventing deadlock by setting limits on the number of resources of each type that can be requested by a process and then providing a sufficient total number of resources evenly distributed across the resource types. We want to know the minimum number of resources required to prevent deadlock for a given number of processes and resource types. Our goal is to devise a mathematical formula to compute this minimal number. To prepare for this task, answer the following questions about the resource allocation graphs provided.
Is a condition of deadlock exhibited in this resource allocation graph?
Is a condition of deadlock exhibited in this resource allocation graph?
Is a condition of deadlock exhibited in this resource allocation graph?
Given P processes, and R resource types, and assuming that each process can request at most m of each type of resource, find an expression for N(P,R,m) that computes the minimum total number of resources evenly distributed over the R resource types that will prevent deadlock. N(P,R,m)= Note: For resources to be "evenly distributed" over the R resource types means that no resource type may have more than 1 more resource that any other resource type. For example, given R=3 and N = 8 we could allocate resources in any of the following ways, while the following are not "evenly distributed".