Download
1 / 13
130 likes | 247 Views
Figure 1.1. RRT incidence rates in the countries of the UK 1990–2012. UK Renal Registry 16th Annual Report. Figure 1.2. Age/gender standardised incidence ratio (2007–2012) by percentage non-White. UK Renal Registry 16th Annual Report.

E N D
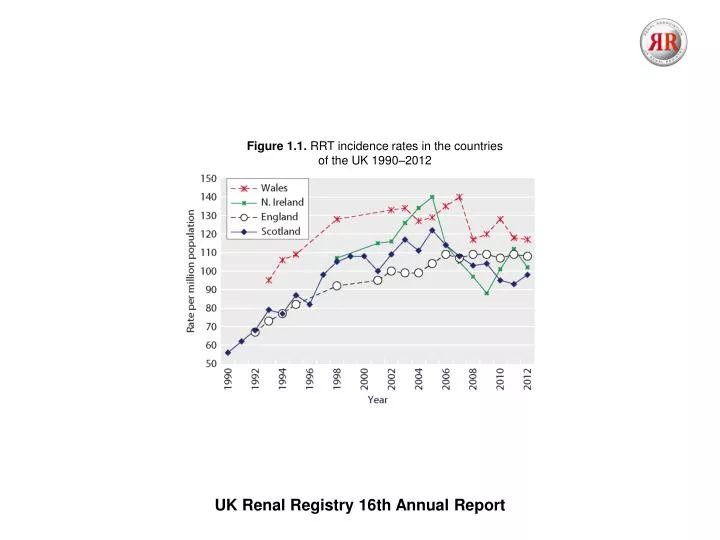
Figure 1.1. RRT incidence rates in the countries of the UK 1990–2012 UK Renal Registry 16th Annual Report
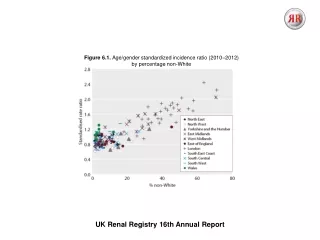
Figure 1.2. Age/gender standardised incidence ratio (2007–2012) by percentage non-White UK Renal Registry 16th Annual Report
Figure 1.3. RRT incidence rates between 1980 and 2012 UK Renal Registry 16th Annual Report
Figure 1.4. RRT incidence rates in 2012 by age and gender UK Renal Registry 16th Annual Report
Figure 1.5. Number of incident dialysis patients in 2012, by age group and initial dialysis modality UK Renal Registry 16th Annual Report
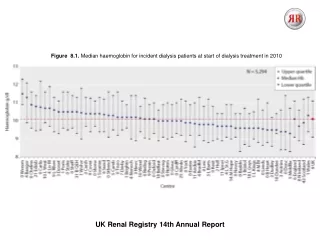
Figure 1.6. Median age of incident RRT patients by centre in 2012 White points indicate transplant centres UK Renal Registry 16th Annual Report
Figure 1.7. Percentage of patients starting RRT in 2012 who were male, by age group UK Renal Registry 16th Annual Report
Figure 1.8. RRT modality at 90 days (incident cohort 1/10/2011 to 30/09/2012) UK Renal Registry 16th Annual Report
Figure 1.9. Geometric mean eGFR at start of RRT (2012) by age group UK Renal Registry 16th Annual Report
Figure 1.10. eGFR on starting RRT 2003 to 2012, PD and HD (restricted to centres reporting since 2003) UK Renal Registry 16th Annual Report
Figure 1.11. Percentage presenting late (2011/2012) UK Renal Registry 16th Annual Report
Figure 1.12. Late presentation rate by year (2007–2012) Restricted to centres reporting continuous data for 2007–2012 UK Renal Registry 16th Annual Report
Figure 1.13. Median duration of pre-RRT care by age group (incident patients 2011–2012) UK Renal Registry 16th Annual Report