Download

1 / 17
180 likes | 356 Views
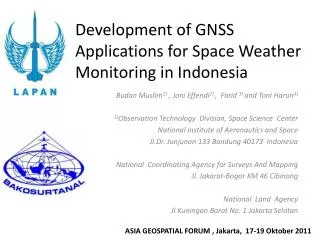
Monitoring wheat rust affected areas through remote sensing – a case study for Punjab. Dr. Sujay Dutta Crop Inventory & Modelling Division ABHG/EPSA Space Applications Centre ISRO Ahmedabad – 380 015 sujaydutta@sac.isro.gov.in. IRS P6 AWiFS Mar.10, 2011.

E N D
Monitoring wheat rust affected areas through remote sensing – a case study for Punjab Dr. Sujay Dutta Crop Inventory & Modelling Division ABHG/EPSA Space Applications Centre ISRO Ahmedabad – 380 015 sujaydutta@sac.isro.gov.in IRS P6 AWiFS Mar.10, 2011
Rational of disease detection using RS data Green and red band is suitable to detect symptom related to change in pigments Near infra red band is suitable for tissue damage detection Shortwave infrared is sensitive to water/ content/drying detection Thermal band is suitable for change in canopy temperature • Basic studies have already shown the requirement of narrow bands for better discrimination of disease levels. Thus, ideally hyper spectral sensor is most suitable.
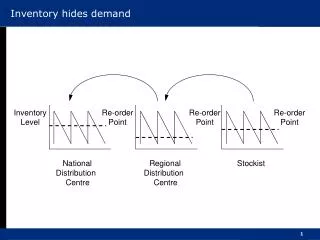
Data Used • IRS P6 AWiFS sensor • Date of satellite pass acquired: December 14, 2010, • January 16, 2011, • February 09, 2011 • March 10 & 25, 2011 Methodology • The wheat crop area was generated under the national project “FASAL” for the same season • The mask of wheat classified pixels were used to derive the NDVI and LSWI profiles of wheat crops for the region of Punjab • Two crop sowing pattern was observed in the study area. Major percent of wheat crop was early sown, where the peak growth stage was observed by mid February
To study the weather situation during the disease occurance, meteorological parameters obtained from Weather Research and Forecasting (WRF; Skamarock et al., 2008, Model version 3.1) was used. WRF Model is integrated for 72 hr with a horizontal resolution of 45 km for the All India grid points. The meteorological parameters used were: daily maximum and minimum air temperature and relative humidity • Study of the spectral profiles of wheat pixels showed sudden fall in NDVI and LSWI profiles from February 9, 2011 to March 10, 2011 in the sub mountainous region of Punjab state compared to other wheat areas in the plains. The observations made by field teams (provided by MOA) in March 8, matches with this. • A logical combination of the rules based on NDVI and LSWI resulted 2-4 per cent of wheat crop was damaged by the disease. • The difference of NDVI and LSWI values between Feb. and March 2011 data were used to derive the percent of negative deviation from Feb. to march. A percent difference image was created to located the infested areas.
Study area: Punjab state wheat crop pixels
Banga block, Nawan Shahar
Mukerian Block , Hoshiarpur NDVI image LSWI image
Maximum air Temperature on feb. 15, 2011 NDVI, Banga Block,Nawansahar
Diurnal difference in maximum and minimum temperature and relative humidity during February at sites with disease incidence. Diurnal difference in maximum and minimum temperature and relative humidity during February at sites away from disease incidence.
limitations of realizing the full potential for crop disease detection Disease cycle being very short, one requires very high temporal resolution data for early detection. Thus, ideally, very high spatial resolution hyper spectral remote sensing data with high temporal resolution is essential for disease detection.
r - r = NIR SWIR LSWI r + r NIR SWIR where LSWI(j) - LSWI value of 10 March,2011 LSWI (i) - LSWI value of 9 Feb., 2011 Land Surface Water Index(LSWI) where ρNIR = reflectance in near infrared band ρ SWIR = reflectance in short wave infrared band ….. Thankyou