Download
1 / 13
130 likes | 276 Views
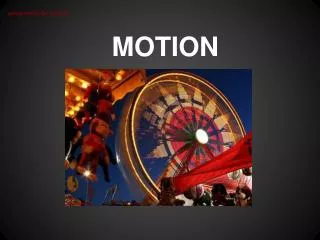
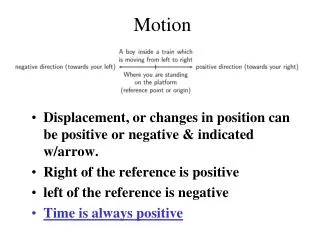
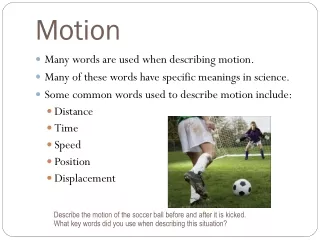
MOTION. Chapter Four: Motion. 4.1 Position, Speed and Velocity 4.2 Graphs of Motion 4.3 Acceleration. 4.2 Graphs of Motion. Constant speed means the speed stays the same. An object moving at a constant speed always creates a position vs. time graph that is a straight line.

E N D
Chapter Four: Motion • 4.1 Position, Speed and Velocity • 4.2 Graphs of Motion • 4.3 Acceleration
4.2 Graphs of Motion • Constant speed means the speed stays the same. • An object moving at a constant speed always creates a position vs. time graph that is a straight line.
4.2 Graphs of Motion • The data shows the runner took 10 seconds to run each 50-meter segment. • Because the time was the same for each segment, you know the speed was the same for each segment.
4.2 Graphs of Motion • You can use position vs. time graphs to compare the motion of different objects. • The steeper line on a position vs. time graph means a faster speed.
4.2 Slope • The slope of a line is the ratio of the “rise” to the “run”. • The steepness of a line is measured by finding its slope.
4.2 Graphs of changing motion • Objects rarely move at the same speed for a long period of time. • A speed vs. time graph is also useful for showing the motion of an object that is speeding up or slowing down.
4.2 Graphs of changing motion • On the graph, the length is equal to the time and the height is equal to the speed. • The area of the rectangle is equal to its length times its height. • Suppose we draw a rectangle on the speed vs. time graph between the x-axis and the line showing the speed.