Download
1 / 15
150 likes | 177 Views
Delve into the basics of significance tests versus confidence intervals, learn how to state hypotheses, interpret P-values, and make conclusions based on statistical evidence. Explore the concepts with interactive examples and grasp the significance level in hypothesis testing.

E N D
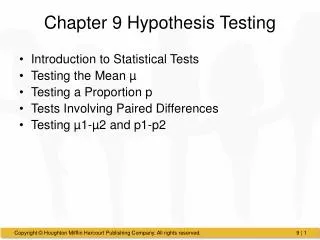
CHAPTER 9Testing a Claim 9.1 Significance Tests: The Basics
Introduction Confidence intervals are one of the two most common types of statistical inference. Use a confidence interval when your goal is to estimate a population parameter. The second common type of inference, called significance tests, has a different goal: to assess the evidence provided by data about some claim concerning a population. A significance test is a formal procedure for comparing observed data with a claim (also called a hypothesis) whose truth we want to assess. The claim is a statement about a parameter, like the population proportion p or the population mean µ. We express the results of a significance test in terms of a probability that measures how well the data and the claim agree.
Activity: I’m a Great Free-Throw Shooter! A basketball player claims to make 80% of the free throws that he attempts. We think he might be exaggerating. To test this claim, we’ll ask him to shoot some free throws—virtually—using The Reasoning of a Statistical Test applet at the book’s Web site.
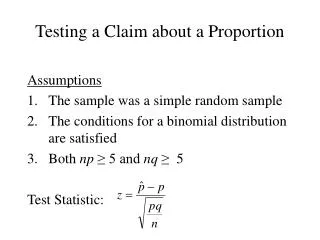
Stating Hypotheses A significance test starts with a careful statement of the claims we want to compare. The claim we weigh evidence against in a statistical test is called the null hypothesis (H0). Often the null hypothesis is a statement of “no difference.” The claim about the population that we are trying to find evidence for is the alternative hypothesis (Ha). In the free-throw shooter example, our hypotheses are H0 : p = 0.80 Ha : p < 0.80 where p is the long-run proportion of made free throws.
Stating Hypotheses In any significance test, the null hypothesis has the form H0: parameter = value The alternative hypothesis has one of the forms Ha: parameter < value Ha: parameter > value Ha: parameter ≠ value To determine the correct form of Ha, read the problem carefully. The alternative hypothesis is one-sided if it states that a parameter is larger than the null hypothesis value or if it states that the parameter is smaller than the null value. It is two-sided if it states that the parameter is different from the null hypothesis value (it could be either larger or smaller).
Stating Hypotheses • The hypotheses should express the hopes or suspicions we have before we see the data. It is cheating to look at the data first and then frame hypotheses to fit what the data show. • Hypotheses always refer to a population, not to a sample. Be sure to state H0and Hain terms of population parameters. • It is never correct to write a hypothesis about a sample statistic, such as
Interpreting P-Values The null hypothesis H0states the claim that we are seeking evidence against. The probability that measures the strength of the evidence against a null hypothesis is called a P-value. The probability, computed assuming H0is true, that the statistic would take a value as extreme as or more extreme than the one actually observed is called the P-value of the test. • Small P-values are evidence against H0because they say that the observed result is unlikely to occur when H0is true. • Large P-values fail to give convincing evidence against H0because they say that the observed result is likely to occur by chance when H0is true.
Statistical Significance The final step in performing a significance test is to draw a conclusion about the competing claims you were testing. We make one of two decisions based on the strength of the evidence against the null hypothesis (and in favor of the alternative hypothesis): reject H0or fail to reject H0. Note: A fail-to-reject H0decision in a significance test doesn’t mean that H0is true. For that reason, you should never “accept H0” or use language implying that you believe H0is true. In a nutshell, our conclusion in a significance test comes down to P-value small → reject H0→ convincing evidence for Ha P-value large → fail to reject H0→ not convincing evidence for Ha
What is considered small/large enough? We compare the P-value to a fixed number, called the alpha value. This is represented by the notation,, pronounced ‘alpha’. If no alpha is given you should use .05. If the p-value is smaller than we say the results are statistically significant. In this case we would reject the null hypothesis.
Type I and Type II Errors When we draw a conclusion from a significance test, we hope our conclusion will be correct. But sometimes it will be wrong. There are two types of mistakes we can make. If we reject H0when H0is true, we have committed a Type I error. If we fail to reject H0when Hais true, we have committed a Type II error.
Type I and Type II Errors The probability of a Type I error is the probability of rejecting H0 when it is really true…this is exactly the significance level of the test. Significance and Type I Error The significance level α of any fixed-level test is the probability of a Type I error. That is, α is the probability that the test will reject the null hypothesis H0 when H0 is actually true. Consider the consequences of a Type I error before choosing a significance level.