Download
1 / 18
200 likes | 384 Views
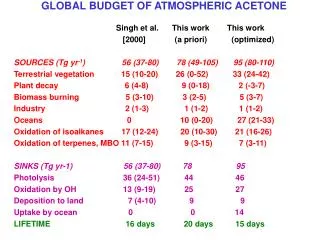
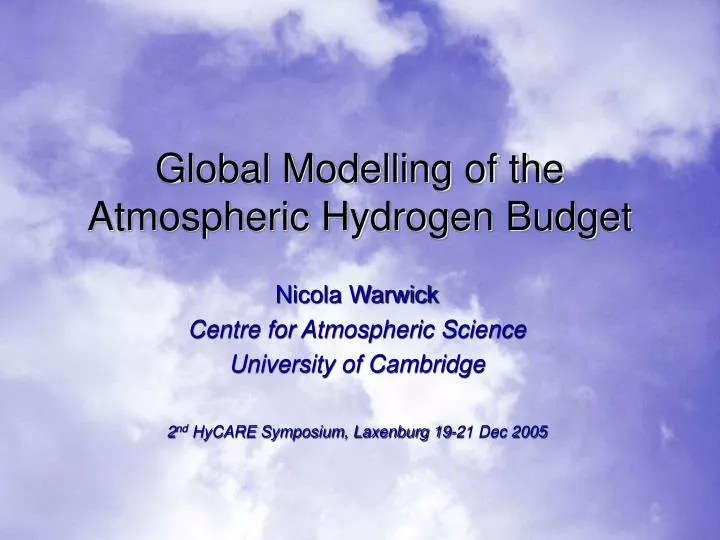
Global Modelling of the Atmospheric Hydrogen Budget. Nicola Warwick Centre for Atmospheric Science University of Cambridge 2 nd HyCARE Symposium, Laxenburg 19-21 Dec 2005. Outline. Model study of the present day hydrogen budget: initial results.

E N D
Global Modelling of the Atmospheric Hydrogen Budget Nicola Warwick Centre for Atmospheric Science University of Cambridge 2nd HyCARE Symposium, Laxenburg 19-21 Dec 2005
Outline • Model study of the present day hydrogen budget: initial results. • Incorporating H2 in p-TOMCAT (sources, sinks) • Model analysis: comparison with observations • Conclusions and future work
p-TOMCAT H2 Model • Resolution: ~2.8° in horizontal, 31 vertical levels to 10 hPa • Simple chemistry: - 5 H2 tracers, coloured by source Sinks: - OH fields: prescribed, taken from full chemistry model - H2 dry deposition velocities, dependent on soil moisture (ECMWF) Sources: - surface H2 emissions: prescribed (present-day IPCC scenarios) - photochemical production H2 calculated from prescribed HCHO fields taken from full chemistry model • ECMWF wind analyses for 1998.
H2 Sources: Surface Emissions Surface H2 emissions / kg km2 month-1 *Emissions taken from latest IPCC scenarios, described in Dentener et al., 2004. Scaled to CO emissions.
H2 Sources: Photochemical Production • H2 produced from photolysis of HCHO in model. • Model HCHO fields compared to: • Satellite data: • Surface observations:
H2 Sources: Photochemical Production • H2 produced from photolysis of HCHO in model. • Model HCHO fields compared to: • Satellite data: • Surface observations GOME HCHO – April 1998 p-TOMCAT HCHO - April 1998
H2 Sources: Photochemical Production • H2 produced from photolysis of HCHO in model. • Model HCHO fields compared to: • HCHO Satellite data • HCHO Surface observations: Birkenes (58°N,8°E) Waldhof (52°N,10°E) Donon (48°N,7°E) Mauna Loa (19°N,155°W)
H2 Sinks: reaction with OH 250 hPa • CH4 lifetime due to reaction with OH = 9.6 yrs 500 hPa 700 hPa Surface 90°S 30°S 0° 30°N 90°N Top: range of OH estimates in Lawrence et al. 2001, Bottom: OH in p-TOMCAT
H2 Sinks: Dry Deposition • H2 dry deposited to 5 landtypes (as Sanderson et al., 2003): • Savannah, forest, agriculture, grasslands: seasonal variation with ECWMF soil moisture. • A single wetlands/peat/tundra category: no seasonal variation H2 dry deposition velocity (102cm/s) - January H2 dry deposition velocity (102cm/s) - July
Global Surface H2 Annual mean surface H2/ppbv Surface H2/ppbv January to December
Global distribution H2 tracers % of total H2 from biomass burning (left = surface, right = 200hPa) % of total H2 from industry (left = surface, right = 200hPa) % of total H2 from photochemistry (left = surface, right = 200hPa)
Latitudinal Distribution: Total H2 Model lat. max. Model lat. min. Model zonal mean X – coastal/oceanic observations X – land observations
Latitudinal Distribution: H2 budget terms Dry deposition Photochemical Production OH Destruction Biomass burning Industrial Ocean Nitrogen Fixation Photochemistry Latitudinal distribution of coloured hydrogen tracers Latitudinal distribution of hydrogen production and loss
H2 Seasonal Cycles: Barrow (71°N,157°W) Biomass burning Photochemistry Nitrogen Fixation Industrial Ocean
H2 Seasonal Cycles: Seychelles (55°E, 5°S) Biomass burning Photochemistry Nitrogen Fixation Industrial Ocean
H2 Seasonal Cycles: Cape Grim (145°E, 41°S) Biomass burning Photochemistry Nitrogen Fixation Industrial Ocean
Conclusions and Future Work • Modelled H2 mixing ratios within 10% observations • Overestimate in SH, underestimate in NH (inaccuracies in sources and/or sinks) • H2 seasonal cycles small in both model and observations (phase differences in NH and SH) • Run multiannual/decadal simulations – trends / interannual variability in H2 • Incorporate hydrogen isotopes • Chemistry-climate simulations using results from present-day study and H2 economy emission scenarios.