Download
1 / 16
160 likes | 264 Views
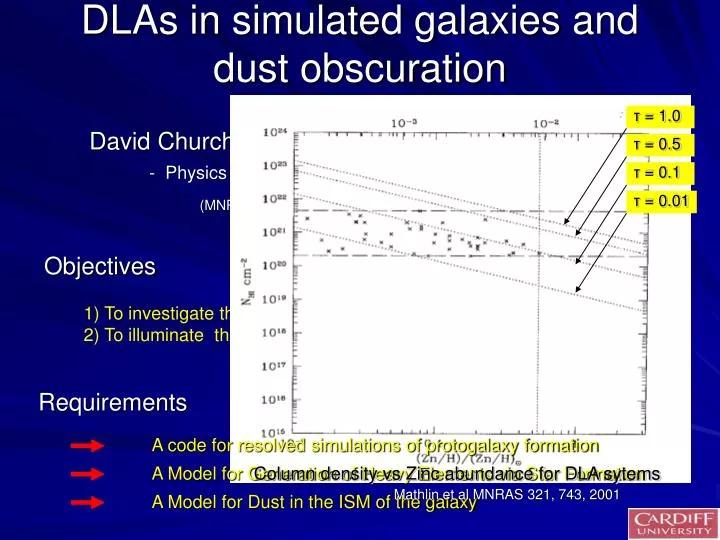
DLAs in simulated galaxies and dust obscuration. τ = 1.0. David Churches, Mike Edmunds, Alistair Nelson - Physics & Astronomy, Cardiff University. τ = 0.5. τ = 0.1. τ = 0.01. (MNRAS 327, 610, 2001 & 347, 1234, 2004). Objectives.

E N D
DLAs in simulated galaxies and dust obscuration τ = 1.0 David Churches, Mike Edmunds, Alistair Nelson - Physics & Astronomy, Cardiff University τ = 0.5 τ = 0.1 τ = 0.01 (MNRAS 327, 610, 2001 & 347, 1234, 2004) Objectives 1) To investigate the plausibility of proto-galaxies as the originators of DLAs 2) To illuminate the effect of dust obscuration on DLA count statistics Requirements A code for resolved simulations of protogalaxy formation A Model for Generation of Heavy Elements via Star Formation Column density vs Zinc abundance for DLA sytems Mathlin et al MNRAS 321, 743, 2001 A Model for Dust in the ISM of the galaxy
Aim of the Simulations CDM N-body simulation of a 240 Mpc box (Virgo consortium ApJ 499, 20, 1998) This is NOT the aim of our simulations Our Aim is to simulate the detailed development of structure and column density at the level of individual galaxies
Galaxy Formation Code Peter Williams - Joint Astrophysical Institute, Shanghai Normal University • Tree-Code/SPH [ with 1/(r + ε) potential ] • Parallelised using mpi - both particle pushing and tree building • Individual Particle Timesteps • Fully dynamic Kernel Radius • Star Formation via a Schmidt Law ( SF = k ρ1.5) • Isothermal Equation of State (Williams,Churches & Nelson ApJ 607, 1, 2004)
Sample Run - Initial ConditionsWilliams & Nelson,A.&A. 2001, 374, 860. • Mass 5x10¹¹ Mסּ – 90% non-baryonic DM, 10% baryonic gas • Initial Radius = Ri 175 kpc • initially solid body rotation with Ω = 0.16 / Gyr (λ = 0.06) • initially in Hubble expansion with Vradial = Hi R , Hi= 560 km/sec per Mpc • sound speed 7.5 km/sec , ε = 175 pc • 33552 gas , 33401 DM particles, finally 46016 star particles Dark Matter Gas
Gas, Star & DM movies (http://www.cf.ac.uk/pub/Alistair.Nelson/index.html) gas only face-on all components face-on all components edge-on gas column density face-on
gas stars dark matter In addition to Morphology, the model galaxies also match observations quantitatively Sample run final state after 9 Gyrs
First - Spiral Shocks Another simulation Gas velocity near central object showing shocks Isothermal shock Pre-shock velocity 38 km/s Sound speed 10 km/sec →Mach number 3.8 Density jumps by a factor of 20 Equivalent to Mach number 4.5
Other Galaxy Properties DM • Rotation Curve • Density Profiles • Star Formation Rates Gas x vs vy - final stellar mass 3.75x10¹⁰ Mסּ - final gas mass 1.25x10¹⁰ Mסּ Stars Gas
5 Gyears 4 Gyears 3 Gyears 2 Gyears 1 Gyear Generation of heavy Elements We apply the simple model(Pagel & Patchett MNRAS 172, 13, 1975) Where Z = Metallicity ρg = gas density p = fraction of the new stellar mass returned to ISM in heavy elements α = fraction of new stellar mass locked up as long- lived stellar remnants and dS/dt = rate of SF per unit volume This formula is applied to all the gas particles, which carry the metallicity Z in the galaxy Z vs time, using Z~23(O/H) (Pagel et al MNRAS 255, 325, 1992) Z vs time, and radius using Z~23(O/H) (Pagel et al MNRAS 255, 325, 1992)
Mini Survey of 5 Models First the column densities and Zinc abundances through vertical sight lines through the gas discs of the models were calculated On 16x16 grid 30 kpc square
Mini Survey of 5 Models Model parameters used :- Mass (1011 Mסּ) 5 5 5 2.5 10 Spin Parameter λ0.06 0.09 0.12 0.09 0.09 a b For each model the Column densities and Zinc abundances were calculated at 4 times from the start of the calculation for the 5x10¹¹ M סּ case time (Gyears) redshift a 1 2.2 b 2 1.3 c 3 0.8 d 5 0.4 c d
M = 5x10¹¹Mסּ, λ=0.06 M = 2.5x10¹¹Mסּ, λ=0.09 M = 5x10¹¹Mסּ, λ=0.09 M = 1012Mסּ, λ=0.09 M = 5x10¹¹Mסּ, λ=0.12 Mini Survey of 5 Models observations The models overlapthe observations, but occupy a larger region, with many high column density sight lines But these have τ > 0.5, which means that they may not be observed (Pei & Fall Ap J ,1995) All the models att = 1 and 2 Gyears
Dust Model The amount of dust is based on the metallicity From Mathlin, Baker, Churches, & Edmunds MNRAS, 321, 743, 2001 Edmunds & Eales MNRAS, 299, L29, 1998. The Optical Depth τ for metallicity Z is given by :- Where Ng = gas column density
0o 60o 80o Varying inclination angle The sight line survey was repeated for 2 other angles of incidence 80o 60o Fraction of sight lines with τ > 0.5 or >1.0 as a function of time for the M = 5x10¹¹Mסּcase 0o Conclusions:- 1) The results support the idea that DLA’s originate in galaxy disks at different stages of evolution 2) Any observational survey which counts the number of DLA’s needs to recognise that up to a significant fraction of them may not have been detected