Download

1 / 33
340 likes | 635 Views
1. Chapter. Overview of Statistics. What is Statistics? Why Study Statistics? Uses of Statistics Statistical Challenges Writing and Presenting Reports Statistical Pitfalls Statistics: An Evolving Field. What is Statistics?.

E N D
1 Chapter Overview of Statistics What is Statistics? Why Study Statistics? Uses of Statistics Statistical Challenges Writing and Presenting Reports Statistical Pitfalls Statistics: An Evolving Field
What is Statistics? • Statistics is the science of collecting, organizing,analyzing, interpreting, and presenting data. • A statistic is a single measure (number) used to summarize a sample data set. For example, the average height of students in this class. • Astatistician is an expert with at least a master’s degree in mathematics or statistics or a trained professional in a related field. McGraw-Hill/Irwin © 2007 The McGraw-Hill Companies, Inc. All rights reserved.
Why Study Statistics? • Communication • Computer Skills • Understanding the language of statistics facilitates communication and improves problem solving. • The use of spreadsheets for data analysis and word processors or presentation software for reports improves upon your existing skills.
Why Study Statistics? • Information Management • Technical Literacy • Statistics help summarize large amounts of data and reveal underlying relationships. • Career opportunities are in growth industries propelled by advanced technology. The use of statistical software increases your technical literacy.
Why Study Statistics? • Career Advancement • Quality Improvement • Statistical literacy can enhance your career mobility. • Statistics helps firms oversee their suppliers, monitor their internal operations and identify problems.
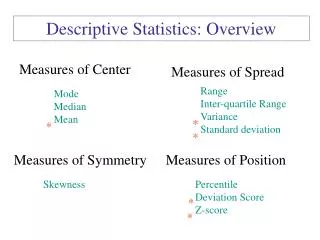
Uses of Statistics • Two primary uses for statistics: • Descriptive statistics – the collection, organization, presentation and summary of data. • Inferential statistics – generalizing from a sample to a population, estimating unknown parameters, drawing conclusions, making decisions.
Statistics Describing Data Making Inferencesfrom Samples VisualDisplays NumericalSummaries EstimatingParameters TestingHypotheses Uses of Statistics • Overview of Statistics
Uses of Statistics • Auditing • Marketing • Sample from over 12,000 invoices to estimate the proportion of incorrectly paid invoices. • Identify likely repeat customers for Amazon.com and suggests co-marketing opportunities based on a database of 5 million Internet purchases.
Uses of Statistics • Health Care • Purchasing • Evaluate 100 incoming patients using a 42-item physical and mental assessment questionnaire. • Determine the defect rate of a shipment and whether that rate has changed significantly over time.
Uses of Statistics • Medicine • Forecasting • Determine whether a new drug is really better than the placebo or if the difference is due to chance. • Manage inventory by forecasting consumer demand.
Statistical Challenges • Is technically current (e.g., software-wise). • Communicates well. • Is proactive. • Has a broad outlook. • Is flexible. • Focuses on the main problem. • The Ideal Statistician
Statistical Challenges • Meets deadlines. • Knows his/her limitations and is willing to ask for help. • Can deal with imperfect information. • Has professional integrity. • The Ideal Statistician
Statistical Challenges • Working with Imperfect Data • Dealing with Practical Constraints • State any assumptions and limitations and use generally accepted statistical tests to detect unusual data points or to deal with missing data. • You will face constraints on the type and quantity of data you can collect.
Statistical Challenges • Upholding Ethical Standards • Using Consultants • Know and follow accepted procedures, maintain data integrity, carry out accurate calculations, report procedures, protect confidentiality, cite sources and financial support. • Hire consultants at the beginning of the project, when your team lacks certain skills or when an unbiased or informed view is needed.
Statistical Challenges • Skills Needed for Success in Business
Writing and Presenting Reports • Rules for Power Writing • Outline the report before you begin. • Complete the report in sections. • Ask trusted peers to review the report and make any necessary revisions. • Be prepared to make multiple revisions.
Writing and Presenting Reports • Writing Style • Answer research question succinctly. • List most important results first. • Include section headings and avoid lengthy paragraphs. • Provide clear data sources. • Use appendices for technical information. • Be stylistically consistent.
Writing and Presenting Reports • Avoid Jargon • Spelling and Grammar • Present technical concepts so that others can understand them. • Don’t rely on software to catch all spelling and grammar errors.
Writing and Presenting Reports • Make it Attractive • Descriptive title. • Date • Author(s) • Page number. • Wide margins. • Typeface and point size. • Bullets and subheadings. • Bold face, italics, color.
Writing and Presenting Reports • Organizing a Technical Report Typical business report style includes: • Executive Summary (1 page maximum)- Briefly describe task and goals, data and data sources, methods that were used, main findings and any limitations. • Introduction (1 to 3 paragraphs)- Statement of the problem- Data sources and definitions- Methods utilized
Writing and Presenting Reports • Organizing a Technical Report Typical business report style includes: • Body of the Report (as long as necessary)- Discussion, explanations, interpretations- Tables and graphs, as needed • Conclusions (1 to 3 paragraphs)- Statement of findings (in order of importance)- Limitations (if necessary)- Future research suggestions
Writing and Presenting Reports • Organizing a Technical Report Typical business report style includes: • Bibliography and Sources • Appendices (if needed for lengthy or technical material)
Writing and Presenting Reports • Tables and Graphs • Embed in the narrative near the paragraph in which they are interpreted. • Number and title each table above the table, each graph below the graph
Writing and Presenting Reports • Rules for Presenting Oral Reports • Select a few key points to convey. • Use simple charts and diagrams. • Emphasize using color and fonts creatively. • Have backup slides or transparencies. • Rehearse timing. • Refer audience to written report for details. • Imagine yourself in the audience.
Writing and Presenting Reports • Pictures Help Make the Point
Writing and Presenting Reports • The Three Ps • Pace yourself when presenting. Take your time, introduce yourself, your data and your project. Make the first minute count. • Plan what your are going to present. Organize your ideas with an outline. Keep it simple! • Practice before presenting to get the timing right. Consider videotaping yourself or practicing in front of peers.
Statistical Pitfalls • Pitfall 1: Making Conclusions about a Large Population from a Small Sample • Pitfall 2: Making Conclusions from Nonrandom Samples • Be careful about making generalizations from small samples (e.g., a group of 10 patients). • Be careful about making generalizations from retrospective studies of special groups (e.g., heart attack patients).
Statistical Pitfalls • Pitfall 3: Attaching Importance to Rare Observations from Large Samples • Pitfall 4: Using Poor Survey Methods • Be careful about drawing strong inferences from events that are not surprising when looking at the entire population (e.g., winning the lottery). • Be careful about using poor sampling methods or vaguely worded questions (e.g., anonymous survey or quiz).
Statistical Pitfalls • Pitfall 5: Assuming a Causal Link Based on Observations • Pitfall 6: Making Generalizations about Individuals from Observations about Groups • Be careful about drawing conclusions when no cause-and-effect link exists (e.g., most shark attacks occur between 12p.m. and 2p.m.). • Avoid reading too much into statistical generalizations (e.g., men are taller than women).
Statistical Pitfalls • Pitfall 7: Unconscious Bias • Pitfall 8: Attaching Practical Importance to Every Statistically Significant Study Result • Be careful about unconsciously or subtly allowing bias to color handling of data (e.g., heart disease in men vs. women). • Statistically significant effects may lack practical importance (e.g., Austrian military recruits born in the spring average 0.6 cm taller than those born in the fall).
Statistics: An Evolving Field • Statistics is a relatively young field, having been developed mostly during the 20th century. • Its mathematical frontiers continue to expand with the aid of computers. • Major recent developments include- Exploratory data analysis (EDA)- Computer-intensive statistics- Design of experiments- Robust product design- Advanced Bayesian methods- and more
Applied Statistics in Business and Economics End of Chapter 1