Download

1 / 24
240 likes | 254 Views
This study analyzes the consequences for U.S. dairy herds of imposing various SCC standards on milk quality measures. It looks at data from 4 out of 10 FMOs, emphasizing the impact on nearly half of the U.S. milk supply. The comparison between U.S. and Canadian SCC standards, as well as E.U. standards, is discussed, along with the geometric vs. arithmetic means in SCC monitoring. The study suggests that U.S. producers need to focus on sound management practices to meet stricter SCC standards and enhance milk quality.

E N D
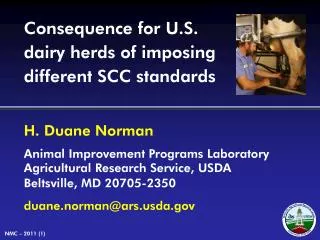
Consequence for U.S. dairy herds of imposing different SCC standards
U.S. milk quality measures • Bulk tank somatic cell count (BT-SCC) • Monitored by USDA • Data from 4 of 10 FMOs • Accounts for nearly 50% of U.S. milk supply • Herd test-day somatic cell count (TD-SCC) • Herds in DHI • Accounts for 94% of U.S. DHI herds
U.S. and Canadian SCC U.S. TD-SCC Québec BT-SCC Ontario BT-SCC
U.S. and New Zealand SCC U.S. TD-SCC New Zealand TD-SCC
U.S. and Irish SCC U.S. TD-SCC Irish BT-SCC
U.S. versus E.U. SCC monitoring Program characteristic U.S. E.U. SCC sample Individual farm Individual farm BT-SCC limit 750K cells/mL 400K cells/mL Value used Consecutive monthly BT-SCC Geometric mean of 3 monthly BT-SCC Producer suspension 3 of 5 consecutive samples over limit 2 consecutive 3-month means over limit
Export concerns • E.U. change in SCC sampling point from bulk truck or plant silo to individual farm • 3-month mean (E.U.) used as single reference for period, which allows more time to reduce future SCC • Geometric mean (E.U.) mathematically lower than arithmetic mean (U.S.) and requires recalculation
SCC noncompliance comparison • DHI herds and FMO herds • Current E.U. and U.S. SCC standards as well as 3 NMPF proposed standards • Percentage of herds • Percentage of milk supply • Examined by month, herd size, and state
DHI Data • SCS converted to SCC for 14,854 DHI herds • Herd requirements • 15–26 tests (Jan. 2009 – Oct. 2010) • ≥10 cows for all test days • Herd TD-SCC used as proxy for BT-SCC • Each cow SCC weighted by her TD milk yield
FMO Data • SCC scores (Jan. 2009 – Oct. 2010) from FMO: • Upper Midwest • Central • Mideast • Southwest • Included 31,830 producers
SCC noncompliance in DHI herds – means* *November 2009 – October 2010
SCC noncompliance in FMO herds – means* *November 2009 – October 2010
SCC herd compliance – state Current U.S., 750K Proposed U.S., 500K Proposed U.S., 600K Proposed U.S., 400K Current E.U., 400K
Conclusions • E.U. changes in SCC enforcement led to reconsideration of stricter U.S. standards • If 400K U.S. SCC limits were used, noncompliance would be higher than if current E.U. standard was applied • For U.S. producers to meet stricter SCC standards, sound management and culling for milk quality need to be emphasized. Is DHI the answer?
Acknowledgment Many thanks to Jason Lombard, USDA:Animal and Plant Health Inspection Service:Veterinary Services, Centers for Epidemiology and Animal Health, Fort Collins, CO for providing the results for the FMO herds.