Download
1 / 10
100 likes | 119 Views
Learn how to calculate the W126 statistic for national air quality standards effortlessly. Impress your peers, understand its importance, and transform hourly values with a simple formula. Follow a cheat sheet and average values to get the W126 value.

E N D
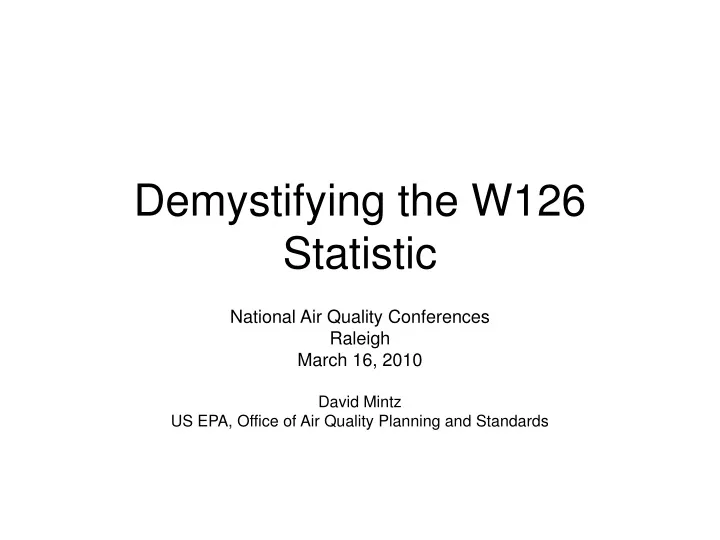
Demystifying the W126 Statistic National Air Quality Conferences Raleigh March 16, 2010 David Mintz US EPA, Office of Air Quality Planning and Standards
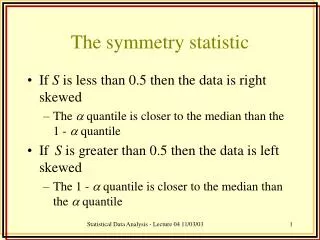
Reasons to know W126 • Sudoku is “out”, W126 is “in” • Impress your Facebook friends • It’s important for plants • It’s really simple… really
How do I calculate it • Transform • Add 3 times • Average
Start with hourly values • 12-hour period 8am-8pm
Transform • Transform the hourly values Cheat sheet: The formula is preprogrammed in Excel at http://www.epa.gov/ttn/analysis/w126.htm
Add • Add the weighted hourly values for each day Daily Value
Add the daily values for each month This example is just May Add Monthly Value
April April May May June June July July August August September September October October Monthly 4.442 9.124 12.983 16.153 13.555 4.364 1.302 Monthly Value 4.442 9.124 12.983 16.153 13.555 4.364 1.302 42.691 3 3 - - Month sum Month sum 26.549 26.549 38.260 38.260 34.072 34.072 19.221 19.221 Add • Add the monthly values for each 3-month period 3-month sums • In this example, there are five 3-month sums in the year
Average • Average the highest 3-month sum from each of the three years This is it!!! W126 value = (42.691 + 23.780 + 20.978)/3 = 29.149666… rounds to 29 ppm-hours
Congratulations! • Now you know how to calculate the W126 statistic! • For additional information, including data summaries, see http://www.epa.gov/ttn/analysis/w126.htm